Happy to share this new paper led by Vítězslav Moudrý. We show that spaceborne canopy height products 🌲🛰️still have clear limits and that in Europe ALS data should be used more, moving toward a European ALS-based canopy height model.
agupubs.onlinelibrary.wiley.com/doi/10.1029/...
11.01.2026 20:07
👍 3
🔁 1
💬 0
📌 0
Great to see that the master’s thesis work of Victoria Mølbach Sforzini, was successfully developed and implemented by Irene Menegaldo during her PhD—and now published in @vegecoldiv.bsky.social Congratulations to both!!
18.12.2025 10:43
👍 3
🔁 0
💬 0
📌 0


New paper out! 🤘
Can we estimate forest biodiversity using spaceborne #EnMAP data? 🛰️
Turns out, yes — spectral heterogeneity from EnMAP can estimate tree species diversity in Alpine forests 🌲🌳🏔️
Especially in the NIR region, with area-weighted pixels and canopy cover > 70%.
🔓 lnkd.in/eWKGeGfs
30.10.2025 07:54
👍 6
🔁 1
💬 0
📌 1
Glad to have contributed to this work!🤩
28.10.2025 00:33
👍 2
🔁 0
💬 0
📌 0


🤩Proud to co-author a new paper led by Petra Pracná & Vítězslav Moudrý (CZU Prague): combining NASA’s ICESat-2 & GEDI LiDAR 🛰️data to build 90 m global DTMs 🌍—matching or surpassing Copernicus DEM accuracy in forests!🌲
🔗 www.sciencedirect.com/science/arti...
16.10.2025 19:38
👍 2
🔁 0
💬 0
📌 0
😎
17.08.2025 17:56
👍 0
🔁 0
💬 0
📌 0


🚨 New research paper! 🌸🐝 UAV RGB + machine learning detect flowers as an indirect proxy for bee abundance—fast, scalable & eco-friendly! www.sciencedirect.com/science/arti...
15.08.2025 16:50
👍 1
🔁 1
💬 0
📌 0


Look who visited our biodiversity plots! 🦊These pics come from our camera traps in Switzerland, part of the ORCHAMP network we’re using in the MAP-Rezia project to monitor biodiversity between Stelvio and the Swiss National Park.
Can we spot the same wild animals using Earth observation?🛰️Stay tuned!
23.07.2025 20:23
👍 5
🔁 0
💬 1
📌 0
@unibz.bsky.social , @euracalpenv.bsky.social
16.05.2025 06:42
👍 1
🔁 0
💬 0
📌 0

Just 2 weeks after setting up plots & camera traps, we’ve got our first visitor! In #MAPRezia (Interreg Italia–Svizzera lnkd.in/eWv5FtPN) we map biodiversity in all forms—plants, trees, and wildlife—using field & remote sensing data. More to come this summer! 🌲🛰️
16.05.2025 06:41
👍 9
🔁 0
💬 1
📌 0
@unibz.bsky.social, @euracalpenv.bsky.social, @marco-mina.bsky.social
08.05.2025 15:21
👍 1
🔁 0
💬 0
📌 0

Fuzzy approaches provide improved spatial detection of coastal dune EU habitats
Mapping habitats on coastal dunes, crucial yet highly vulnerable ecosystems, requires objectivity and repeatability, which are still lacking in the im…
Have you ever thought outside the box and created fuzzy maps? 🗺️
Our study, led by Emilia Pafumi, shows how fuzzy classification offers a more realistic approach to habitat mapping using high-res satellite imagery🛰️ www.sciencedirect.com/science/arti... #biodiversity #remotesensing #ecology #mapping
04.03.2025 09:30
👍 2
🔁 0
💬 0
📌 0

L’AI in difesa delle foreste dell’Ucraina
Un sistema di allerta precoce basato sull’intelligenza artificiale rivela una massiccia perdita di foreste in Ucraina durante la guerra.
La guerra in #Ucraina ha un impatto drammatico anche sull’ambiente. @micheletorresani.bsky.social, ricercatore di #unibz, in collaborazione con #unibo, ha sviluppato un sistema di allerta precoce per stimare la perdita di superficie forestale. Leggi di più: www.unibzmagazine.it/en/magazine/...
13.02.2025 13:38
👍 0
🔁 1
💬 0
📌 0


Just returned from the @esa.int #biospace25 conference hold in Frascati-Rome where I present my research on the link between different aspects of #biodiversity and vegetation height heterogeneity, assessed through remote sensing data 🌲 🛰️
If you missed my talk you can find it here: lnkd.in/eNxqeuMc
13.02.2025 09:59
👍 1
🔁 0
💬 0
📌 0
in collaboration with: @unibz.bsky.social, @euracalpenv.bsky.social, @marco-mina.bsky.social, Roberto Tognetti, Luca Corlatti, Luca Pedrotti, Christian Rossi, Sebastian Marzini.
09.02.2025 11:17
👍 3
🔁 1
💬 0
📌 0

🌿 Kick-off for the #MAP-Rezia Project! 🌿
Excited to launch MAP-Rezia (~€1M, #InterregItaliaSvizzera) to monitor biodiversity in #ParcoNazionaledelloStelvio & #SchweizerischerNationalpark! We'll use remote sensing to map ecosystems, track herbivores & assess forest scenarios under climate change. 🚀🌍
09.02.2025 11:17
👍 1
🔁 0
💬 1
📌 1

Sensors with a view
Not all fieldwork pictures are equally breathtaking. While part of our team waded through the muddy mud of De Driehoek – one of our university campus’s last patches of nature – an…
Not all fieldwork pictures are equally breathtaking... The pictures I got from master student Sarane reading out
#microclimate sensor data from the cliffs of Freyr might just be what you needed to want to join MIREN's rock survey...
the3dlab.org/2025/02/03/s...
03.02.2025 18:25
👍 16
🔁 4
💬 0
📌 0

During the war in Ukraine, alongside the devastating loss of human lives, vast areas of forests have also been destroyed. In this new paper we estimated this forest loss using AI and remote sensing data🌲📡 #forest #war #Ukraine #remotesensing #Landsat
www.sciencedirect.com/science/arti...
17.01.2025 08:45
👍 1
🔁 0
💬 0
📌 1

Community Ecology
Community Ecology, established by the merger of two ecological periodicals, Coenoses and Abstracta Botanica was launched in an effort to create a common ...
Excited to share I’ve joined the Editorial Board of Community Ecology (Springer: link.springer.com/journal/42974)! 🌍📖
Looking forward to contributing to its mission and promoting impactful work, especially bridging ecological research with remote sensing technologies 🌲🛰️
16.01.2025 10:47
👍 0
🔁 0
💬 0
📌 0
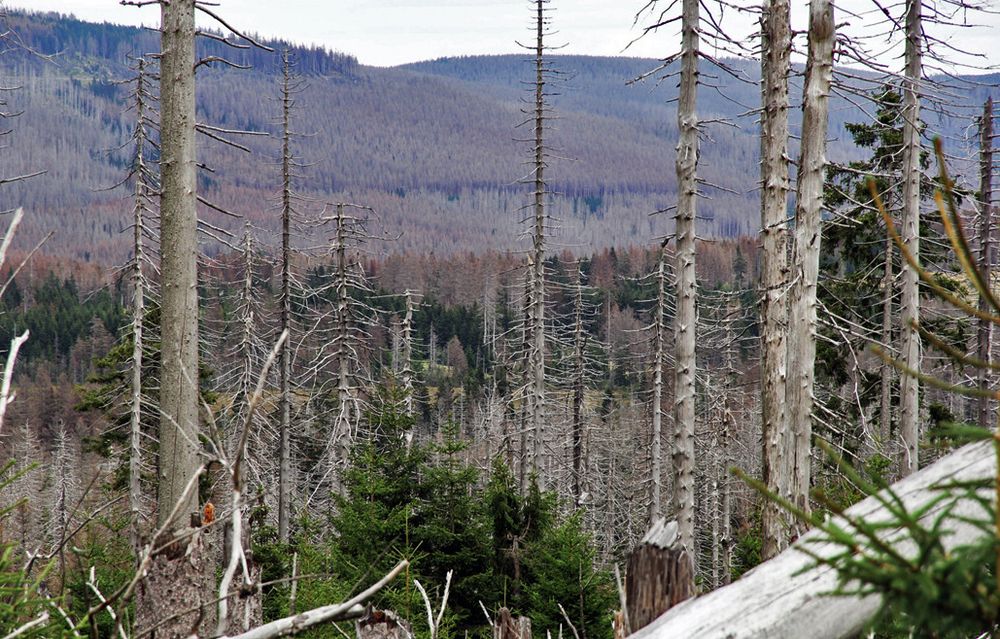
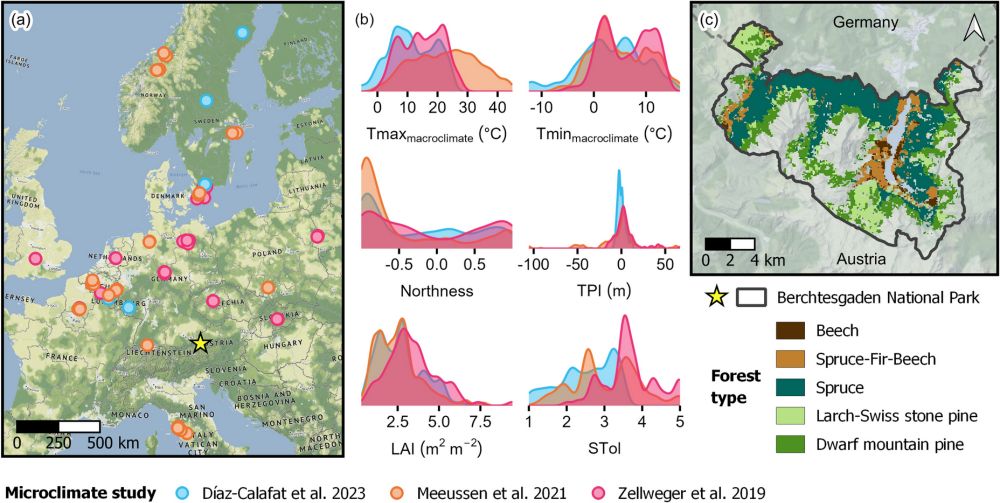
New paper! Forest disturbance through drought, windthrow, pest outbreaks and fire is increasing in Europe, driven by past planting decisions and climate change. In Germany alone, more than 500,000 ha of mostly Spruce died back in 2018-2022. Led by Anne Graser, we studied biodiversity responses...
20.12.2024 12:46
👍 51
🔁 15
💬 5
📌 1
I’m thinking of creating a new starter pack on "Remote sensing for forest biodiversity monitoring". I need at least seven others to join me—who’s interested?
07.01.2025 11:57
👍 1
🔁 0
💬 0
📌 0
Ready to learn how to use LiDAR for research in #forestry and natural resources using #R? This week I am sharing our 7-part series on Bluesky to help you get started! Share with anyone you know who wants to get started. Part 1 covers acquiring, & viewing LiDAR data! bit.ly/lidR-module1
06.01.2025 15:33
👍 47
🔁 26
💬 4
📌 3

(a) Map showing locations of 157 studies included, and the proportion of natural, agricultural, and urban habitats sampled within the study. Pie size is proportional to the number of sampled sites in each study, ranging from 1 to 368. The density plot indicates the distribution of the studied assemblages (n = 3117) along the latitudinal gradient. (b–d) Diversity changes relative to values of natural habitats, with each panel showing responses of one diversity metric: (b) α-, (c) β-, and (d) γ-diversity. Point estimates represent model predictions of each land use based on fixed effects only, while error bars are 95% confidence intervals. The estimations of α-diversity were obtained by holding other covariates at the mean or mode values. For β- and γ-diversity, the estimation reflects a standardized sampling study with all assemblages having 100% sampling completeness, and other covariates at the mean or mode values. Small letters above error bars indicate results from pairwise comparisons, with different letters representing different groups. *Indicates that the pairwise comparisons included marginally nonsignificant results (p = 0.06).
Land-use change reduces bee diversity at local scales, but the impacts of agriculture and urbanisation differ at regional scales. Agriculture has more negative effects overall. onlinelibrary.wiley.com/doi/10.1111/... 🧪 🌏 🌐
06.01.2025 10:25
👍 89
🔁 44
💬 2
📌 0

Hi all, Happy New Year🍾
If you want to start 2025 learning about LiDAR technology and its practical applications in ecology using R, do not miss this course with @micheletorresani.bsky.social
There is ONLY 1 seat left: www.physalia-courses.org/courses-work...
02.01.2025 11:13
👍 1
🔁 1
💬 0
📌 0