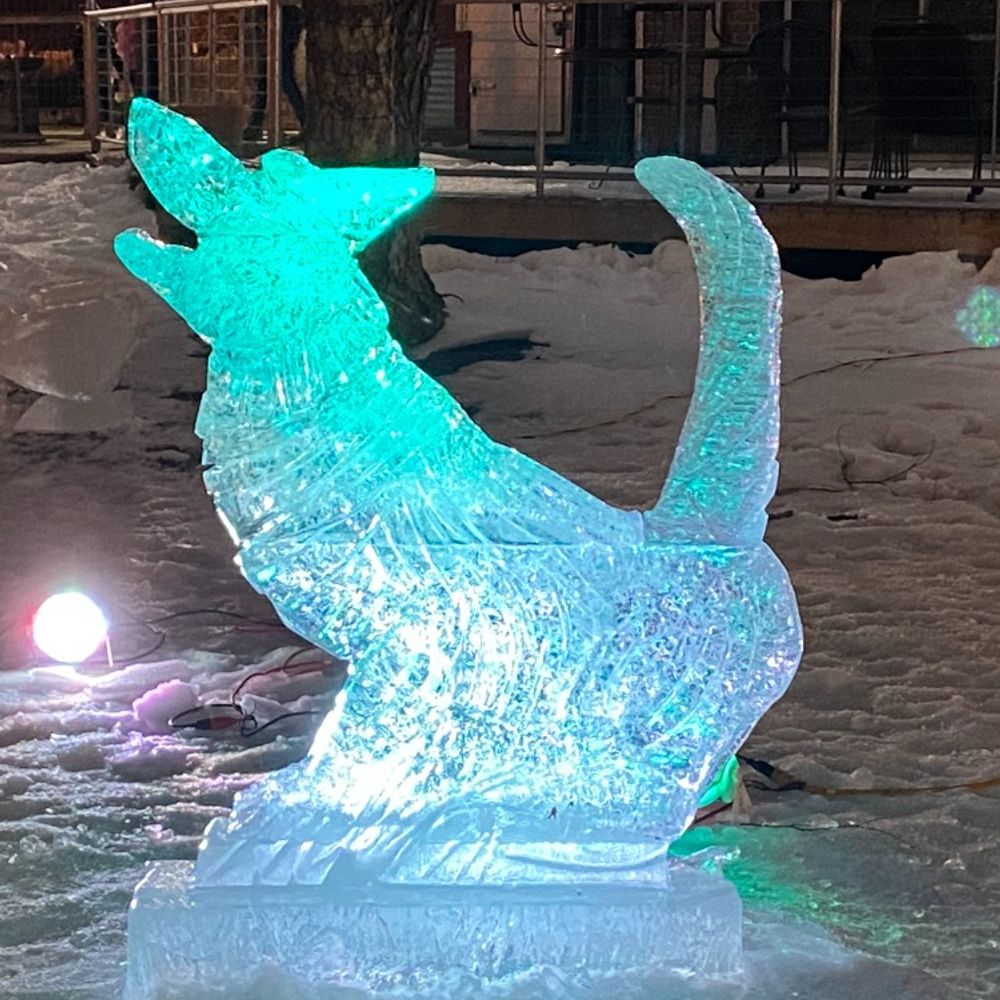
Heat map-style graphic showing monthly air temperature rankings in the Arctic at the 925 hPa level for each month from January 1979 to February 2026. There is a long-term warming trend evident in each month. Blue shading is shown for colder months, and red shading is shown for warmer months. A yellow number is shown for each grid box to display the actual temperature ranking. February 2026 was the 30th warmest February on record.
#Arctic air temperature rank by month over the satellite era - now updated through February 2026 (a rare unusually cold month compared to recent years)...
+ Ranks: 1=warmest (red), 47/48=coldest (blue)
+ Download higher resolution: zacklabe.com/arctic-tempe...
07.03.2026 14:44
👍 68
🔁 17
💬 3
📌 1
I always thought the Wet Mountain Valley would be a good place to live.
07.03.2026 14:54
👍 1
🔁 0
💬 0
📌 0

Two modes of transportation, rail and barge. On the Ohio River in Maysville KY. Not seeing as much coal as in the “old” days.
06.03.2026 23:02
👍 1
🔁 0
💬 0
📌 0
Great way to take power out of the hands of inept and corrupt politicians.
06.03.2026 17:42
👍 7
🔁 2
💬 0
📌 0

There is No Scientific Justification to Revoke the Endangerment Finding
The U.S. EPA's decision to repeal the Endangerment Finding will limit the government's ability to regulate emissions of carbon dioxide and other greenhouse gases under the Clean Air Act.
As I say here, there is no scientific justification to revoke the engagement finding. In fact, over the last 15+ yrs, the evidence of how climate change affects our health has only grown. Higher risk of allergies, dementia, fertility, heart disease, and death: that’s what’s on the line. @nature.org
12.02.2026 21:44
👍 1406
🔁 649
💬 33
📌 14
They don’t care about random home users. It’s all about corporate systems. I’m still on Win10 and not switching. LibreOffice works reasonably well too.
04.03.2026 04:32
👍 1
🔁 0
💬 1
📌 0
I guessing the vast majority of the audience did not catch the error, which circles back to the discussion of what is the most effective way to graphically depict a general forecast for the majority of viewers.
04.03.2026 02:32
👍 1
🔁 0
💬 1
📌 0
There is merit to that idea. But it would be an interesting sociological study to see what people actually want in a forecast and how they interpret various graphics toward their decisions. Extreme events get this sort of attention, but I'd be curious to see more regarding basic weather forecasts.
04.03.2026 01:56
👍 1
🔁 0
💬 0
📌 0

Seems an appropriate multicultural post as we languish in the Second Gilded Age. #oligarchs
04.03.2026 01:46
👍 1
🔁 0
💬 0
📌 0

a drawing of a person standing next to a soap box that says im done now
ALT: a drawing of a person standing next to a soap box that says im done now
The approach of showing frontal and high and low pressure systems is a classic, multi-generational example of graphical jargon. Many viewers don't really understand (or even have interest) in this. Just give them graphics of sensible weather and the forecast with appropriate explanations. 😀
04.03.2026 01:41
👍 1
🔁 0
💬 2
📌 0
That’s quite a bump in the road ahead. 🙀
03.03.2026 22:47
👍 5
🔁 0
💬 0
📌 0

Thanksgiving cactus doing a late winter reprise. Funny sometimes is plant interaction with day length. 🌱
02.03.2026 22:53
👍 24
🔁 0
💬 2
📌 0
💯
02.03.2026 22:25
👍 1
🔁 0
💬 0
📌 0

With none of Trump’s public rationales making any sense, the most compelling reason to start a war seems to be to distract from the growing Epstein files scandal. trib.al/v8UtCni
28.02.2026 20:35
👍 129
🔁 36
💬 13
📌 5
The real ignorance here is that the CPC does nothing in the climate change realm. But nuance is lost on the ignorant clusterflop of bumblefuks running the government.
27.02.2026 01:38
👍 21
🔁 4
💬 1
📌 0
How about a day watching the news when no story was consequential. When neither the President nor Congress nor Supreme Court were the headline. When international conflict was not a story. When news anchors were reporters not commentators. I ask a lot, I know.
26.02.2026 23:35
👍 10
🔁 1
💬 1
📌 0
Thinking of all those coal-powered plants along the Ohio River. Ugh.
26.02.2026 22:46
👍 1
🔁 0
💬 0
📌 0
The Jerry Seinfeld Effect
26.02.2026 18:03
👍 0
🔁 0
💬 0
📌 0

Time series plot of carbon dioxide levels over the last 10,000 years, combining ice core measurements and direct air measurements.
Human civilization arose under a stable atmosphere of 260-280 ppmv of carbon dioxide.
Then, humans learned to utilize the power of fossil fuels.
In a geologic blink, fossil fuel burning has increased atmospheric carbon dioxide levels by more than 50%.
26.02.2026 08:35
👍 86
🔁 43
💬 2
📌 6
Iowa Republicans like to blame high nitrate levels in state waterways on geese. Population of various critters in the state from official sources.
~90,000 geese
55 million chickens
25 million hogs
12 million turkeys
3.5 million cattle
For perspective, 3.2 million people.
Yeah it's the geese. 🙄🤡
25.02.2026 03:09
👍 2
🔁 1
💬 0
📌 0
What a normal deer looks like after listening to Trump’s “speech” tonight. 😮
24.02.2026 23:42
👍 2
🔁 0
💬 0
📌 0

No surprise the AWSSI reflects the impact of the recent snow on this winters index for Providence.
24.02.2026 18:15
👍 1
🔁 0
💬 0
📌 0
There is also the inaccurate conflation of PoP with QPF. Some people in some climate regions think higher PoPs mean higher rainfall amounts while the definition as you cited is 0.01 inch or more.
21.02.2026 17:38
👍 2
🔁 0
💬 0
📌 0
Given my typing skills and the radar today, that’s a realistic typo.
20.02.2026 04:35
👍 1
🔁 0
💬 0
📌 0
🌱 U. Florida sells tomato seeds from their breeding program as well. Best varieties I have grown in the Midwest.
20.02.2026 02:25
👍 24
🔁 5
💬 2
📌 0

Good stuff
20.02.2026 02:14
👍 1
🔁 0
💬 0
📌 0
Home | Drought Risk Atlas
Check out the Drought Risk Atlas if you want to dig deeper on this story. droughtatlas.unl.edu
19.02.2026 23:18
👍 1
🔁 0
💬 0
📌 0