Den er baseret på partiernes faktiske handlinger og ikke blot løfter, men traditionelle kandidattests har også deres berettigelse.
Jeg delte denne, da den er mindre kendt end kandidattest fra DR, TV2 etc.
28.02.2026 21:45
👍 0
🔁 0
💬 1
📌 0

The pace at which US wealth concentration is rising is simply staggering
The concentration of AI wealth into the hands of a few tech barons + plutocratic capture ==> unchartered territory
15.02.2026 14:47
👍 4183
🔁 1853
💬 129
📌 319

Aktuelle odds fra Danske Spil på statsminister efter Folketingsvalget #dkpol #ftvalg
26.02.2026 11:50
👍 2
🔁 1
💬 0
📌 0
Der er udskrevet valg til Folketinget til afholdelse tirsdag den 24. marts 2026 #dkpol #ftvalg
26.02.2026 11:49
👍 2
🔁 0
💬 0
📌 0

Screenshot of the OVA website, showing all courses
The Open Visualization Academy (OVA) IS LIVE!
openvisualizationacademy.org
Thread follows #dataViz #infographics #dataJournalism #dataVisualization
30.01.2026 15:09
👍 232
🔁 107
💬 8
📌 24

Geografisk spredning i investeringer: pensionsselskaber vs. husholdninger vs. MSCI World Index
08.12.2025 18:47
👍 2
🔁 1
💬 0
📌 0

Full comic here: www.smbc-comics.com/comic/slam
#smbc
(including the best closing line I've ever written)
19.06.2025 16:16
👍 417
🔁 66
💬 12
📌 3

South Korea gender divide update 😲
Young men lean right by 50 points
(74% conservative vs 24% centre-left)
Young women lean left by 22 points
(58% centre-left vs 36% cons)
04.06.2025 10:01
👍 1125
🔁 369
💬 50
📌 181

Economic uncertainty update:
The thing about veering wildly between policy positions, favouring and then discarding a new maverick advisor each week, and using contradictory justifications at every turn, is that even if one particular pivot is in the direction of sanity, chaos is the constant.
10.04.2025 15:09
👍 913
🔁 295
💬 35
📌 36

New consumer sentiment data just out for April:
Americans’ expectations for how the economy will fare over the next year are now at their worst in 45 years.
Consumer confidence is down 40% since Trump’s inauguration, including a 20% drop among Republicans.
11.04.2025 14:40
👍 864
🔁 368
💬 38
📌 105

NEW 🧵
The number of people travelling from Europe to the US in recent weeks has plummeted by as much as 35%, as travellers have cancelled plans in response to Trump’s policies and rhetoric, and horror stories from the border.
Story: www.ft.com/content/6dc1...
11.04.2025 19:03
👍 5430
🔁 2101
💬 242
📌 409

NEW 🧵
A quick thread of charts showing how Trump’s economic agenda is going so far:
1) US consumers are reacting very very negatively.
These are the worst ratings for any US government’s economic policy since records began.
04.04.2025 12:51
👍 3562
🔁 1504
💬 90
📌 254
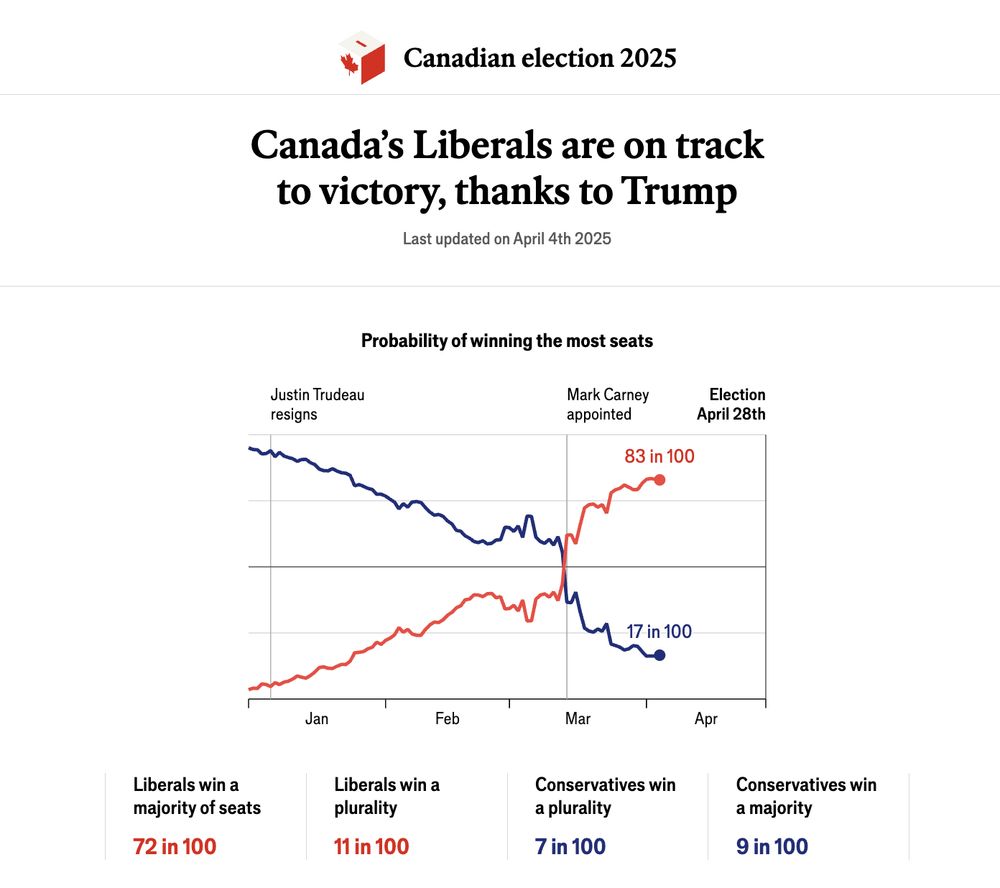
Screenshot of the forecast page, showing a time series of the Liberal Party's chances of winning the election rising from 4% in January to 83% today
Our forecast of the Canadian election is live 📈🇨🇦
We give the Liberal Party an 83% chance of winning the most seats on 28th April
www.economist.com/interactive/...
04.04.2025 10:14
👍 219
🔁 50
💬 6
📌 11
ABC News has now fully taken down the old 538 website, including all interactive projects since 2014. Aside from erasing history this prevents access to publicly released data, including raw polls, averages, model estimates & story dta. Totally unacceptable for a company (allegedly) doing journalism
08.03.2025 17:00
👍 5329
🔁 1335
💬 110
📌 175
Just a reminder that all the data FiveThirtyEight collected—polls, election results, and much more—is available for download (for now) on our GitHub page. github.com/fivethirtyei...
05.03.2025 19:38
👍 312
🔁 81
💬 7
📌 4

GDPNow
Provides a
ATLANTA FED: "The GDPNow model estimate for real GDP growth (seasonally adjusted annual rate) in the first quarter of 2025 is -1.5 percent."
www.atlantafed.org/cqer/researc...
28.02.2025 16:13
👍 334
🔁 102
💬 39
📌 123


DOGE savings www.nytimes.com/2025/02/25/u...
27.02.2025 17:34
👍 0
🔁 0
💬 0
📌 0

"Societies change their minds faster than people do: Generational replacement is what shifts public opinion"
www.economist.com/graphic-deta...
25.02.2025 23:30
👍 60
🔁 17
💬 0
📌 1

Clear east-west divide in Germany this election
24.02.2025 16:04
👍 0
🔁 0
💬 0
📌 0

NEW: updated long-run gap in voting between young men and women in Germany:
Gender divide continues to widen, but contrary to what is often assumed, young men continue to vote roughly in line with the overall population, while young women have swung sharply left.
www.ft.com/content/29fd...
24.02.2025 09:16
👍 5293
🔁 1485
💬 203
📌 265
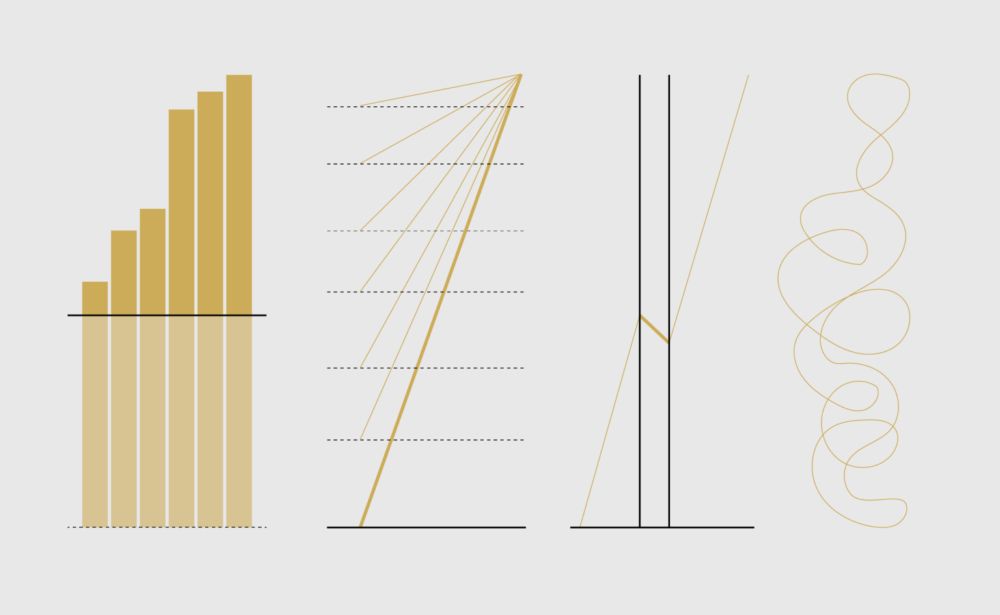
Defense Against Dishonest Charts
This is a guide to protect ourselves and to preserve what is good about turning data into visual things.
Dishonest charts are coming from all directions, and they're only going to hit harder. Unless we push back. So, an interactive guide: Defense Against Dishonest Charts flowingdata.com/projects/dis...
13.02.2025 21:44
👍 504
🔁 250
💬 32
📌 58
Are we on the verge of a global trade war? | Ed Conway analysis
YouTube video by Sky News
📽️What on earth is happening with US tariff policy?
Could tariffs really, as Donald Trump hinted, replace income tax?
And what does this mean for everyone else?
My five minute primer. An attempt to Make Tariffs Interesting Again 👇
youtu.be/59cf99eJcJM?...
22.01.2025 17:12
👍 33
🔁 6
💬 4
📌 0
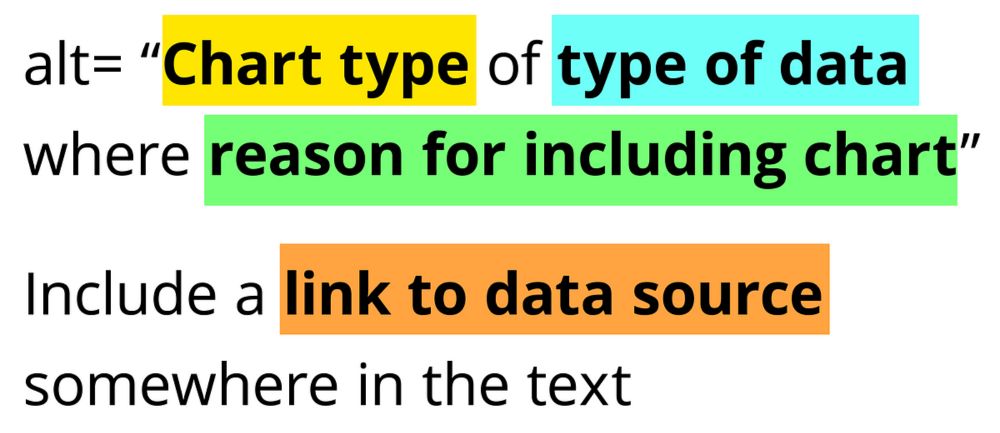
Writing Alt Text for Data Visualization
How do you write text that conveys the whole meaning of a visualization? You probably can’t. But that doesn’t mean that you shouldn’t try
Many struggle with writing alt text for charts and other other data visualizations. Amy Cesal's "Writing Alt Text for Data Visualization" hammers home the importance of explaining the chart type, the type of data, and the reason for the chart.
medium.com/nightingale/...
18.01.2025 23:29
👍 80
🔁 35
💬 2
📌 4

hexagonal tile with 10 package logos
new week, new packages and tools in the LLM + #rstats space
{gander} joins the family and has a very cool logo
luisdva.github.io/rstats/LLMsR/
20.01.2025 18:24
👍 44
🔁 14
💬 0
📌 0

YouGov's MRP for the 2025 German election shows a strong East/West divide, with the AfD leading in all but two constituencies in the former East Germany
yougov.co.uk/internationa...
17.01.2025 10:22
👍 25
🔁 8
💬 3
📌 19