

We are hiring for a metabolomics position here at UC Riverside! Come join the vibrant research and mass spectrometry community here!
aprecruit.ucr.edu/JPF02151
19.11.2025 23:52
👍 4
🔁 2
💬 0
📌 0
We are hiring for a metabolomics position here at UC Riverside! Come join the vibrant research and mass spectrometry community here!
aprecruit.ucr.edu/JPF02151

To help make more mass spec data accessible - we've just rolled out a change to enable universal spectrum identifier resolution and plotting directly from mzML files in Zenodo. We're growing support from more sources in GNPS2 for public data reanalysis!
metabolomics-usi.gnps2.org/dashinterfac...

Interested in a co-authorship?
We’re building a tool for repository-scale untargeted #metabolomics and #exposomics of #environmental data. To make it the best it can be, we’re looking for people willing to share high-resolution LC-MS/MS (DDA) data from #water, #soil, #sediment, and related samples.
GNPS2 and associated services will be down for power maintenance tonight and into tomorrow.

We just crossed the 800,000 files mark in Pan-ReDU. That's 800,000 public #metabolomics raw data files with harmonized metadata that can be re-analyzed to learn about new molecules and bio-distributions. 🎉 redu.gnps2.org
still in development
Yes, don't use that for the moment in classical networking
Yes, you can do that, thats the default intensity threshold. That is relative to the base peak in the MS2.
So now the 85 peak will need to be within 10% of the intensity of the 393 peak. You can put any expression on the 85 peak to modulate up or down for what you want
QUERY scaninfo(MS2DATA) WHERE MS2PREC=393.2283:TOLERANCEMZ=0.1: INTENSITYMATCH=Y:INTENSITYMATCHREFERENCE AND MS2PROD=85.029:TOLERANCEMZ=0.1: INTENSITYMATCH=Y:INTENSITYPERCENT=10
Hi @galanojeanmarie.bsky.social Yes, you're just missing one thing with the variable Y to determine the peak intensity of the second one.
LOL - fun problem to have. I think this might be possible - I think the main graphml, we'll just need to get the actual task and display title.
Thanks for the feedback - let me see if we can integrate. We've already added direct links for modifinder - so we can easily push it out to the resolver as well with the mirror plots.

The Mass Spectrometry Query Language (MassQL) is an open-source language for instrument-independent searching across mass spectrometry data for complex patterns of interest via concise and expressive queries without the need for programming skills.
www.nature.com/articles/s41...
Thanks @ucriverside.bsky.social for featuring our work!
news.ucr.edu/articles/202...

If you're new to MassQL - definitely checkout the research briefing that describes how MassQL enables scientists to precisely express and reproducibly search for mass spectrometry patterns in large datasets:
www.nature.com/articles/s41...
and find the full article:
www.nature.com/articles/s41...
I am thrilled to share after years of work/procrastination that the MassQL manuscript is finally published in @natmethods.nature.com - "A universal language for finding mass spectrometry data patterns". This was an team effort from all co-authors that helped shape MassQL and how it could be used.
We are back online!

MS-RT: A Method for Evaluating MS/MS Clustering Performance for Metabolomics Data pubs.acs.org/doi/10.1021/...

Congrats to all the people who put in tremendous effort to make this study possible. Such a fun project!
www.cell.com/cell/fulltex...
#space #metabolomics #microbes

#FeaturedProtocol this week is a #reversemetabolomics protocol, in which a tandem #massspec spectrum is used as a search term to probe public #metabolomic data, enabling discovery of new metabolic associations bit.ly/4hdyQQF
Big thanks to Xianghu Wang for all the work as lead author and all coauthors who made this possible and the funding from @corteva.bsky.social
While most of the clustering innovation in mass spectrometry has focused largely in proteomics - we hypothesize due to the ability to assess performance - I hope that tools like MS-RT can accelerate the computational innovation in metabolomics.

After validation, we used MS-RT to evaluate the performance of several commonly used MS/MS clustering tools used in proteomics, specifically MS-Cluster and Falcon. We found that Falcon made generally favorable tradeoffs between purity can clustering completeness (how much was actually clustered).
We validate this MS-RT approach by using proteomics MS/MS dataset and comparing the purity estimates from MS-RT with estimates using state-of-the-art proteomics database search approaches. We found that while not exactly identical the relative order across clustering tools is maintained.
To address this, we introduce MS-RT which uses the retention time dimension within individual LC/MS/MS dataset to estimate the clustering purity (how often different molecules make it into the same MS/MS cluster).
While we're accustomed to being able to evaluate clustering performance in MS/MS proteomics clustering - by using FDR controlled database search - this is a missing piece in MS/MS clustering in metabolomics.
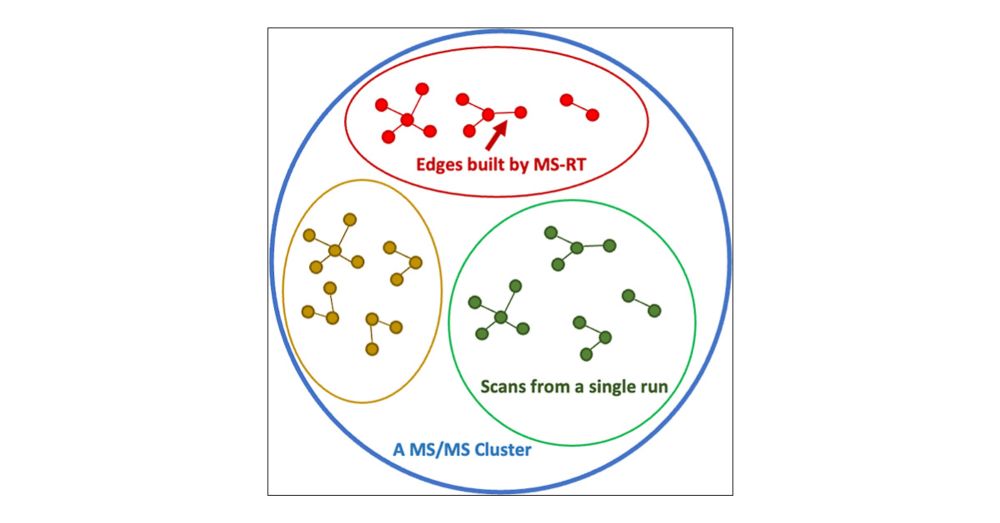
I am excited to share this new paper out in JPR - "MS-RT: A Method for Evaluating MS/MS Clustering Performance for Metabolomics Data." This work introduces the MS-RT method to assess MS/MS clustering accuracy on metabolomics data.
doi.org/10.1021/acs....
GNPS2 is planning on being down for server maintenance tomorrow at 12PM PST. We expect 5 hours of downtime to move servers, bring online new storage, and increase networking performance.
Massive has a workflow that does this, I think called protein explorer