Should biology put complexity first?
The dictum “Everything should be made as simple as possible, but no simpler” poses a problem for biology. How simply can it be told without doing dama…
Great perspective by @philipcball.bsky.social.
Elementary genetics teaching (HS/college) focuses on Mendelian traits (single gene => single trait). However, it is now clear that polygenicity and pleiotropy are the norm. Curriculum must change accordingly.
www.sciencedirect.com/science/arti...
01.03.2026 12:00
👍 33
🔁 15
💬 0
📌 0
Faculty position at the department of medicine, University of Chicago. Please share.
19.12.2025 03:28
👍 8
🔁 11
💬 0
📌 0

Specificity, length and luck drive gene rankings in association studies - Nature
Genetic association tests prioritize candidate genes based on different criteria.
How do GWAS and rare variant burden tests rank gene signals?
In new work @nature.com with @hakha.bsky.social, @jkpritch.bsky.social, and our wonderful coauthors we find that the key factors are what we call Specificity, Length, and Luck!
🧬🧪🧵
www.nature.com/articles/s41...
07.11.2025 00:05
👍 171
🔁 74
💬 5
📌 11
It's a joke. Not a real quote
28.10.2025 22:12
👍 0
🔁 0
💬 1
📌 0
BTW, I'm always looking for students, postdocs, collaborators and minions. DM me if you're interested in working together.
24.10.2025 02:18
👍 1
🔁 1
💬 0
📌 0
(and apologies that the peer review process took so bloody long...)
24.10.2025 01:53
👍 2
🔁 0
💬 1
📌 0
Endless thanks to @gcbias.bsky.social , @arbelharpak.bsky.social, @lukeoconnor.bsky.social, @docedge.bsky.social, @jgschraiber.bsky.social, @mollyprz.bsky.social, and the editors and (most) reviewers for providing indispensable feedback.
24.10.2025 01:50
👍 3
🔁 0
💬 1
📌 0
This project could not have been done without the mentorship of @gs2747.bsky.social & @jkpritch.bsky.social and the hard work of @hakha.bsky.social , Julie Zhu and @courtsmithrun.bsky.social.
24.10.2025 01:50
👍 3
🔁 0
💬 1
📌 0
Side note: As part of the prolonged review process, we showed (in our supplement) using extensive data analysis and simulations that while COJO hits are not necessarily causal, they do a phenomenally good job at tagging the number, frequency and effect sizes of the true underlying causal variants.
24.10.2025 01:50
👍 3
🔁 1
💬 1
📌 0
Our conclusion is that the genetic architecture is well-described by a model of pleiotropic stabilizing selection, and well-approximated by a single distribution of selection coefficients for all traits. Differences between traits are driven by scaling with target size and heritability per site.
24.10.2025 01:50
👍 1
🔁 0
💬 1
📌 0

However, after we scale effect sizes by the heritability per site and account for differences in GWAS power, the genetic architectures of height and FEV1 look identical. The same is true for all other traits as well.
24.10.2025 01:50
👍 1
🔁 0
💬 1
📌 0

The same isn’t true of traits that differ in their heritability per site, like height and FEV1.
24.10.2025 01:50
👍 0
🔁 0
💬 1
📌 0

Therefore, two traits that differ in their target size but not in their heritability per site will differ only in the number of variants affecting them, but not in the variants’ joint distribution of frequencies and effect sizes. Just what we see for height and platelet crit.
24.10.2025 01:50
👍 2
🔁 1
💬 1
📌 0
The number of variants affecting a trait is proportional to the target size. The squared effect size of these variants (in units of the phenotypic variance) is proportional to the heritability per site, the heritability over the target size.
24.10.2025 01:50
👍 1
🔁 0
💬 1
📌 0

So why do traits differ in their genetic architecture?
While the distribution of selection coefficients is similar between traits, traits vastly differ in their target size and heritability.
The genetic architecture scales with these two parameters:
24.10.2025 01:50
👍 1
🔁 1
💬 1
📌 0

As validation of our inferred distribution of selection coefficients we looked at allele ages:
RELATE infers the GWAS hits for our 95 traits to be younger than matched controls, indicating they are under selection. Our model predicts very well the distribution of allele ages.
24.10.2025 01:50
👍 1
🔁 0
💬 1
📌 0
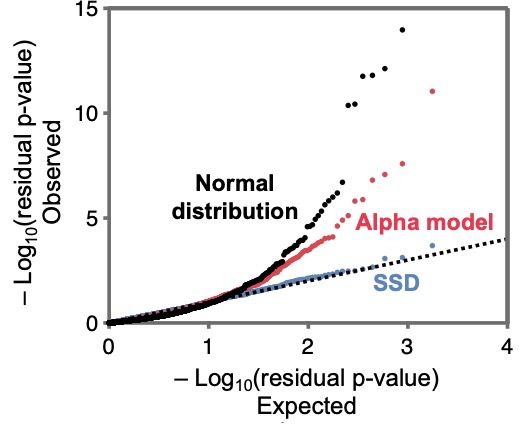
The single shared distribution (or SSD) model fits the data very well and much better than simple heuristic models with a Normal distribution of effect sizes.
24.10.2025 01:50
👍 2
🔁 0
💬 1
📌 0

We therefore, suggest a useful approximation where we assume that there is a single shared distribution of selection coefficients among traits.
24.10.2025 01:50
👍 0
🔁 0
💬 1
📌 0

We infer these 3 components for 95 continuous traits in the UK biobank.
While there are differences in the distribution of selection coefficients between traits, their confidence intervals overlap.
24.10.2025 01:50
👍 0
🔁 0
💬 1
📌 0

Our model has three components:
(1) The target size for a trait - the number of sites where a mutation would affect a given trait.
(2) The distribution of selection coefficients at those sites.
(3) The mean heritability per site – the heritability divided by the target size.
24.10.2025 01:50
👍 0
🔁 0
💬 1
📌 0
For example, in the UK biobank, there are approximately 1500 independent GWAS hits for height which explain about 40% of height’s heritability. For FEV1, there are only 350 hits that explain roughly 10% of the heritability.
How can we explain such differences?
24.10.2025 01:50
👍 0
🔁 0
💬 1
📌 0
Even using the same dataset, GWAS for different traits identify different number of significantly-associated genetic variants (“GWAS hits”) for different traits and these variants explain different proportions of the traits’ heritabilities.
24.10.2025 01:50
👍 0
🔁 0
💬 1
📌 0
Endless thanks to @gcbias.bsky.social, @arbelharpak.bsky.social, @lukeoconnor.bsky.social , @docedge.bsky.social, @jgschraiber.bsky.social , @mollyprz.bsky.social, and the editors and (most) reviewers for providing indispensable feedback.
24.10.2025 01:40
👍 0
🔁 0
💬 0
📌 0
This project could not have been done without the mentorship of @gs2747.bsky.social & @jkpritch.bsky.social and the hard work of @hakha.bsky.social, Julie Zhu and @courtsmithrun.bsky.social.
24.10.2025 01:40
👍 0
🔁 0
💬 1
📌 0
Side note: As part of the prolonged review process, we showed (in our supplement) using extensive data analysis and simulations that while COJO hits are not necessarily causal, they do a phenomenally good job at tagging the number, frequency and effect sizes of the true underlying causal variants.
24.10.2025 01:40
👍 0
🔁 0
💬 1
📌 0
Our conclusion is that the genetic architecture is well-described by a model of pleiotropic stabilizing selection, and well-approximated by a single distribution of selection coefficients for all traits. Differences between traits are driven by scaling with target size and heritability per site.
24.10.2025 01:40
👍 0
🔁 0
💬 1
📌 0

However, after we scale effect sizes by the heritability per site and account for differences in GWAS power, the genetic architectures of height and FEV1 look identical. The same is true for all other traits as well.
24.10.2025 01:40
👍 0
🔁 0
💬 1
📌 0

The same isn’t true of traits that differ in their heritability per site, like height and FEV1.
24.10.2025 01:40
👍 0
🔁 0
💬 1
📌 0