Depends what you are studying. Consistently ranked first in the US in petroleum engineering and in Biological and Agricultural Engineering. Also best in state in ISE, ME and MSE. Also VetMed #5 in the US.
12.09.2025 21:26
👍 1
🔁 0
💬 1
📌 0
That might be a little aspirational, but people do love it here.
12.09.2025 21:20
👍 2
🔁 0
💬 0
📌 0
There are still a lot of serious scholars at Texas A&M. We appreciate your sympathy and are doing the best we can. There are good things about the place: e.g., we have some great students. Also not a propitious time to be looking for a job. Keep an eye out for our students on the job market!
12.09.2025 21:19
👍 0
🔁 0
💬 0
📌 0

In 34 states and D.C., more people say abortion generally should be legal than say it generally should be illegal. For example, in the District of Columbia, 81% of adults say abortion should be legal in all or most cases. Support for legal abortion also stands at about 75% or higher in several New England states, including Vermont, Massachusetts, Rhode Island, New Hampshire and Connecticut.
Meanwhile, people in Arkansas are more likely to say abortion should generally be illegal (57%) rather than legal (41%). Arkansas is the only state where the balance of public opinion is against abortion by a statistically significant margin.
In 15 states, the shares saying abortion should be legal and saying it should be illegal are not significantly different once the margins of sampling error in each state are taken into account.
The balance of public opinion is against abortion being legal in only one state, Arkansas.
www.pewresearch.org/short-reads/...
14.07.2025 17:22
👍 161
🔁 56
💬 8
📌 8
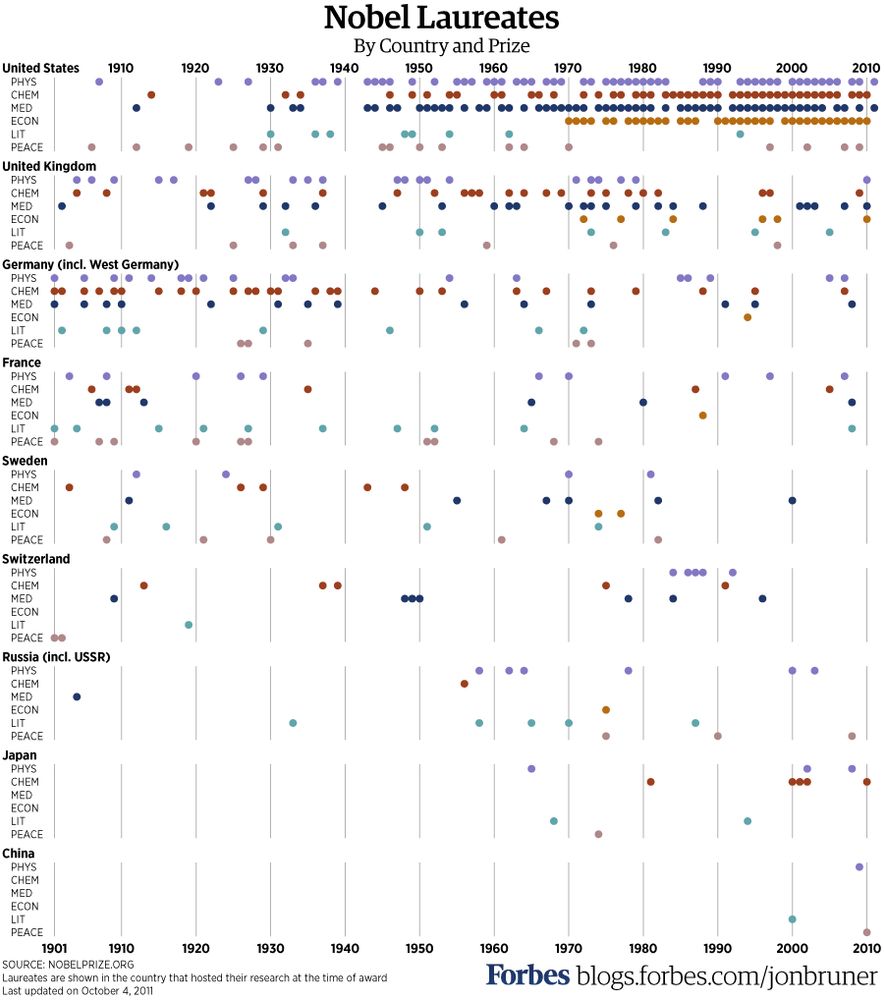
Nobel Prizes by country and year.
The dominance of Germany is striking every time. Before 1933, that is. And the utter dominance of America (and the UK) after 1945.
28.03.2025 15:22
👍 679
🔁 240
💬 48
📌 42
Sounds like fun!
31.03.2025 13:55
👍 1
🔁 0
💬 0
📌 0
relatedly: bsky.app/profile/code...
31.03.2025 13:36
👍 201
🔁 36
💬 3
📌 2

Are you ready to put away your wallet tomorrow? I’m all in!
27.02.2025 20:45
👍 3705
🔁 1108
💬 136
📌 95
Go, Janet!
28.02.2025 04:21
👍 9
🔁 0
💬 0
📌 0
Oh no.
27.02.2025 01:30
👍 0
🔁 0
💬 0
📌 0
I concur. Thanks to all who organized and attended/.
27.01.2025 19:29
👍 3
🔁 0
💬 0
📌 0
three things editors can do: (i dont think theres much hope for changing what referees do.)
/3
24.12.2024 15:07
👍 12
🔁 3
💬 2
📌 1
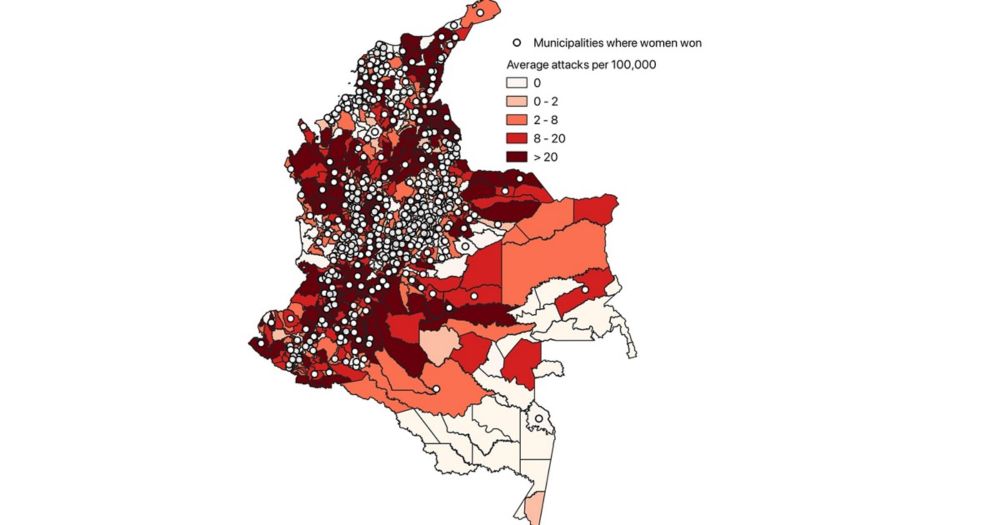
Breaking the Cycle of Violence: How Female Leaders Curb Armed Conflict. Guest post by Francisco Eslava
Breaking the Cycle of Violence: How Female Leaders Curb Armed Conflict. Guest post by Francisco Eslava blogs.worldbank.org/en/impacteva... via the World Bank
27.11.2024 16:56
👍 77
🔁 17
💬 0
📌 1
Update: this list has now 100 (!) women political economists to follow! 🤩
Thanks so much for the (self-)recommendations, I'm thrilled to connect and reconnect with you all here & so looking forward to learning more about your work!
Still 50 spots open! 🙋
go.bsky.app/QFrdfh3
27.11.2024 13:40
👍 235
🔁 99
💬 34
📌 4

This map shows where the world's carbon emissions come from. Population centers emit a large share of emissions but flight paths, shipping lanes and high production areas are also visible as sources of carbon emissions.
This map shows where the world's carbon emissions come from - population centers, flight paths, shipping lanes and high production areas.
www.visualcapitalist.com/cp/mapped-ca...
02.12.2024 00:37
👍 86
🔁 32
💬 3
📌 1
Just the facts.
02.12.2024 00:49
👍 8
🔁 2
💬 0
📌 0
Ryan has a new way to look at things.
02.12.2024 00:46
👍 4
🔁 0
💬 0
📌 0

Law-Abiding Immigrants: The Incarceration Gap between Immigrants and the US-Born, 1870–2020†
By Ran Abramitzky, Leah Boustan, Elisa Jácome,
Santiago Pérez, and Juan David Torres*
We provide the first nationally representative long-run series (1870–2020) of incarceration rates for immigrants and the US-born. As a group, immigrants have had lower incarceration rates than the US-born for 150 years. Moreover, relative to the US-born, immigrants’ incarceration rates have declined since 1960: immigrants today are 60 percent less likely to be incarcerated (30 percent relative to US-born Whites). This relative decline occurred among immigrants from all regions and cannot be explained by changes in observable characteristics or immigration policy. Instead, the decline is part of a broader divergence of outcomes between less-educated immigrants and their US-born counterparts.

Panels plotting incarceration rates for immigrants and US-born men between 1870 and 2019. Data are restricted to males ages 18–40. Data spanning 1870–1940 are from the full-count decennial censuses. Data spanning 1950–1990 are from the largest available subsamples from the corresponding decennial censuses. Data from 2005 onward are from the annual ACS. Cross markers indicate that fewer than 10,000 immigrants were used to calculate the corresponding incarceration rate. Panel A compares US-born men to all immigrants. Panels B–F compare US-born men to immigrants from a particular country-of-origin group. “Old Europeans” are immigrants from countries in the north and west of Europe. “New Europeans” are immigrants from countries in eastern and southern Europe. The “Rest of the world” category includes immigrants from countries not included in panels B–F.
Migrants typically show lower incarceration rates

accounting for individual-level characteristics, migrants as a group or by subgroups (old Europeans, new Europeans, Chinese, Mexicans and Central Americans, or Rest of the World) are incarcerated at lower rates
I've posted several times about the working paper, but the publication on "AER: Insights" is a good occasion to do it again: immigrants to the US have been less likely to be incarcerated for over 50 years **even without controlling for demographic characteristics.**
www.aeaweb.org/articles?id=...
01.12.2024 22:30
👍 104
🔁 43
💬 2
📌 4

Cool new paper! "Strength in Numbers? Gender Composition, Leadership, and Women’s Influence in Teams" by @profkarpo.bsky.social, Stephen D. O’Connell, Jessica Preece, Olga Stoddard #Econsky polisky
12.10.2023 21:55
👍 28
🔁 7
💬 3
📌 1

Texas A&M University Economics were well represented at the Southern Economic Association meetings in Washington DC. This is a great meeting for seeing folks who aren't necessarily on the fancy circuit, lots of wonderful scholars from many different schools.
27.11.2024 18:49
👍 7
🔁 0
💬 2
📌 0
Really excellent lecture by Kasey Buckles! The best thing I saw at SEA this year.
26.11.2024 18:39
👍 3
🔁 1
💬 1
📌 0
Ok folks, here is the job ad for our Empirical IO Assistant Professor position and how to apply: usccareers.usc.edu/job/los-ange...
We'll be moving fast so please encourage all of your students to apply quickly.
📈📉
11.01.2024 19:09
👍 9
🔁 10
💬 0
📌 0
OK, chart time. Big picture: Job growth remains solid. The "acceleration" in November was entirely due to the return of striking workers, but even accounting for that, gains are steady, albeit down from earlier this year. #NumbersDay
08.12.2023 13:52
👍 28
🔁 4
💬 3
📌 1
For professional reasons I must change how I interact with social media
I am getting solicitations to apply for deanships
Gotta up the swearing and over-sharing
08.12.2023 16:49
👍 76
🔁 4
💬 6
📌 0

Here it is! Our new standing RFP for causal research proposals on crime/CJ! This replaces our previous practice of invite-only submissions for most research.
Please share with your networks, including PhD students.
craftmediabucket.s3.amazonaws.com/uploads/Caus...
08.12.2023 16:15
👍 23
🔁 16
💬 2
📌 0
🔥🔥🔥Are you pissed about Armin Falk heading IZA? If yes, consider reading/sharing/signing this letter. To be clear I didn’t organize this letter, and I’m so pleased that instead of me it was more senior economists (some male) who stepped up to help with this effort. docs.google.com/document/d/1...
14.11.2023 13:30
👍 18
🔁 13
💬 0
📌 1
Hi Everyone! New job ⚠️ alert for UVA| Batten.
We are looking for a *Full* or Associate Professor with specialty in Health Economics.
Deadline: December 9, 2023
More information at apply.interfolio.com/135055
Feel free to email me questions and help me spread widely!
15.11.2023 18:16
👍 6
🔁 7
💬 0
📌 0
Similar.
10.11.2023 18:46
👍 0
🔁 0
💬 0
📌 0