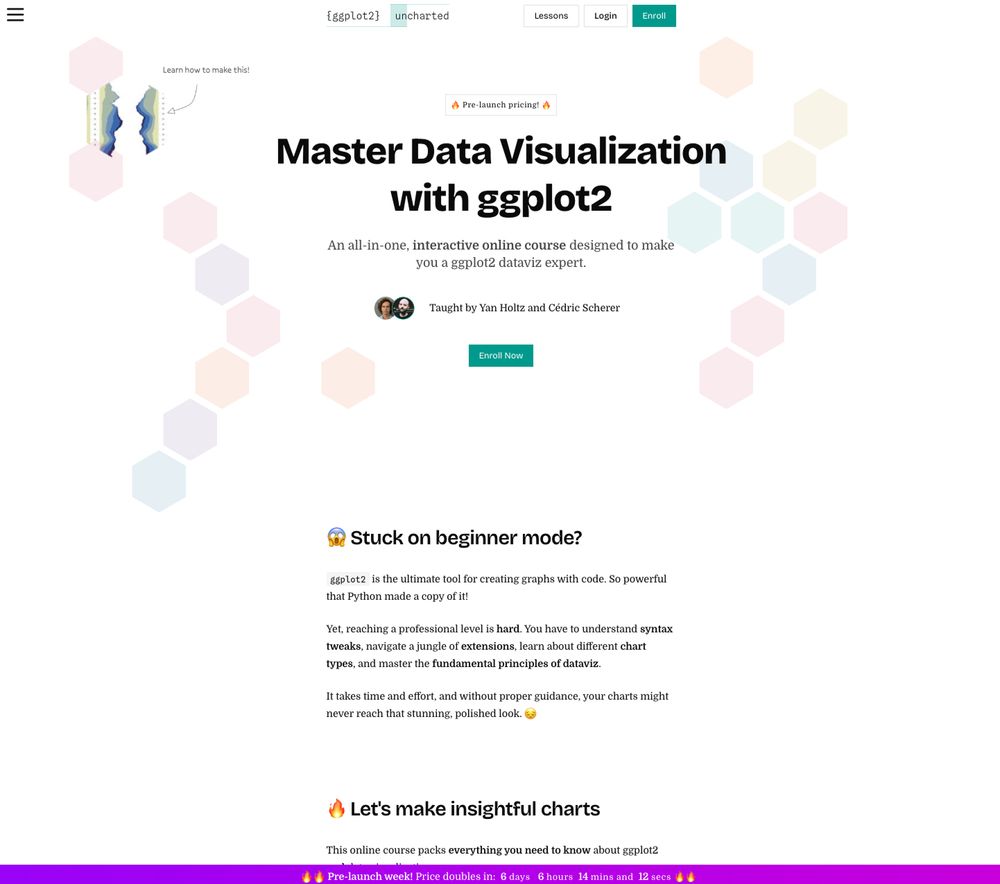
The landing page of the course "ggplot2 uncharted" with the title teasing it with "Master Data Visualizations with ggplot2".
Excited to launch "ggplot2 [un]charted" with @yan-holtz.bsky.social! 🎉
An online course to master #ggplot2 with exercises, quizzes, and modules—and hands-on code running in your browser!
Still WIP—sign up now for a limited discount:
👉 www.ggplot2-uncharted.com
#rstats #DataViz #DataVisualization
12.05.2025 15:58
👍 167
🔁 49
💬 5
📌 11


La bataille de Trafalgar a conduit à l’essor de la #betterave sucrière, les #carottes sont devenues oranges à cause de la ville du même nom, le carême orthodoxe a drastiquement modifié le #tournesol… Autant d’exemples développés dans mon livre “Pourquoi les bananes n’ont-elles pas de pépins?”
12.05.2025 12:05
👍 4
🔁 1
💬 1
📌 1
Hey everyone! Does anyone know if there’s a book about Quarto, like the existing book for Shiny? #rstats #python #Quarto #Books #DataScience
14.03.2025 08:55
👍 2
🔁 2
💬 1
📌 0

Guerilla advertising seen in the London Metro
01.03.2025 22:29
👍 55672
🔁 10599
💬 385
📌 418

01.03.2025 17:32
👍 4
🔁 0
💬 0
📌 0

London Data Visualisation February - Blender Workshop · Luma
If you feel inspired by the visual journalism of the New York Times, winners of the Information is Beautiful awards or the wonderfully crafted graphics of…
Excited to announce my hands-on & in person workshop: "Introduction to 3D maps and data visualisation with Blender". You will learn how to create memorable 3D visualisations that stand out. #dataviz
Register here: lu.ma/gtg2elht
11.02.2025 17:07
👍 18
🔁 6
💬 1
📌 0
De rien, merci pour les données publiées, ça me permettra de croiser avec notre carte.
En complément , une application de la carte publiée pour évaluer l’expo des écoles aux épandages de pesticides :
bsky.app/profile/bjnn...
13.01.2025 09:42
👍 1
🔁 0
💬 0
📌 0
En lien
bsky.app/profile/bjnn...
12.01.2025 05:18
👍 1
🔁 0
💬 1
📌 0
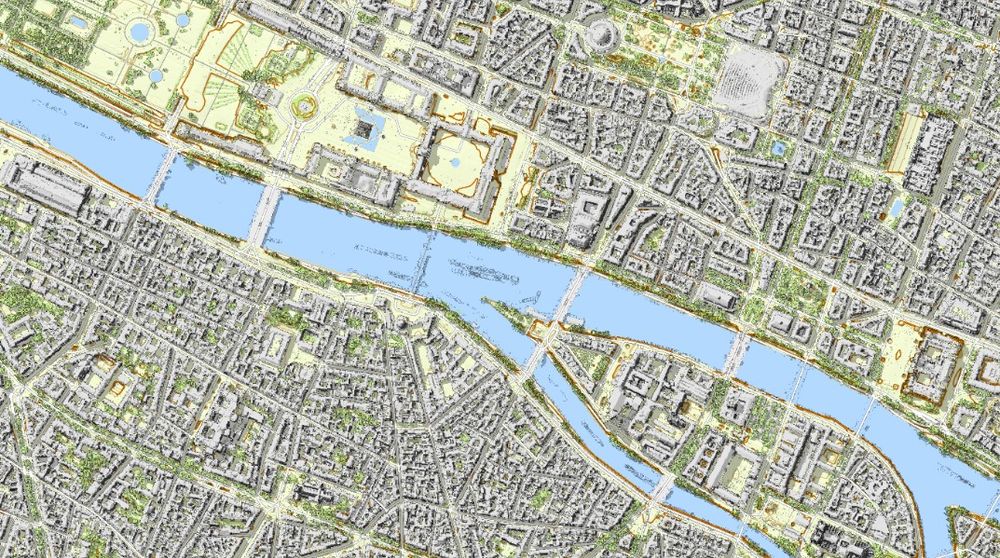
Welcome to my cartographic tour of France, with #LiDAR #mapping ! It starts from Paris here:
➡️ jgaffuri.github.io/CartoHD_webm...
#cartography #gis #gischat #map #maps #dataviz #datavis
05.01.2025 20:09
👍 77
🔁 16
💬 7
📌 1

Always normalize you data
I recently came across a map from the National Atlas of Spain showing the number of libraries by municipality. However, one thing directly caught my attention. There’s a saying that many maps show onl...
I am starting 2025 with a completely renewed blog based on Quarto. I have also updated all the previous posts. The first post addresses the issue of the lack of data normalization I observed in the Spanish National Atlas.
#rstats #dataviz
dominicroye.github.io/blog/2025-01...
06.01.2025 10:35
👍 106
🔁 27
💬 6
📌 1
Did not know about it, thanks for the ref !
22.12.2024 12:29
👍 1
🔁 0
💬 0
📌 0

Map of French departments, mimicking lego blocks

Map of UK

Map of Italy
Lego maps made with #RStats
Tutorial posted on R Graph Gallery:
r-graph-gallery.com/web-chorople...
26.11.2024 16:20
👍 136
🔁 32
💬 6
📌 6
One year timelapse for the guitar-shaped forest
We see the fields evolving between bare earth, vegetation and bare earth again while the forest remains green [...]
16.12.2024 15:26
👍 3
🔁 3
💬 1
📌 0
Many thanks Denis !
20.12.2024 08:33
👍 0
🔁 0
💬 0
📌 0
Unfortunately this is not in my area of expertise so I wouldn't know how to map it correctly ;)
19.12.2024 13:44
👍 0
🔁 0
💬 0
📌 0
🔗Link to #RStats (Quarto & Closeread) code to create this application:
github.com/BjnNowak/jou...
19.12.2024 12:42
👍 8
🔁 2
💬 1
📌 0
🙏🙏🙏
19.12.2024 12:15
👍 1
🔁 0
💬 0
📌 0
Thank you Ian 🙏!
19.12.2024 10:16
👍 1
🔁 0
💬 0
📌 0
I will share the code soon then, it may be useful as a starter !
19.12.2024 10:15
👍 1
🔁 0
💬 1
📌 0
Thank you Miska! It’s actually easy to do with Quarto X Closeread
19.12.2024 09:46
👍 2
🔁 0
💬 1
📌 0
Great images showing the 40% pollution reduction in Paris thanks to bike lanes & traffic changes. It works and people in Paris are loving it! #ShareGoodNewsToo
19.12.2024 00:32
👍 1211
🔁 371
💬 11
📌 20

Bivariate choropleth of population density and pesticide treatment intensity

Zoom on the brittany region

Surrounding of the school of Villeneuve, whose pupils were poisoned by pesticide applications

Map of schools most exposed to pesticides in France
A Journey Through France : a scrollytelling story about exposure of the French population to pesticides, with a focus on exposure of schoolchildren
bjnnowak.quarto.pub/journey_to_f...
18.12.2024 14:15
👍 49
🔁 18
💬 5
📌 4
Merci Abdel ! La résolution est de 100m. Tu peux télécharger les cartes si tu veux tenter une autre analyse, c’est fait pour ! (Lien à la fin de l’application)
18.12.2024 14:31
👍 2
🔁 0
💬 0
📌 0
Thank you Mireia !
18.12.2024 14:30
👍 1
🔁 0
💬 0
📌 0
Bivariate choropleth of population density and pesticide treatment intensity
Zoom on the brittany region
Surrounding of the school of Villeneuve, whose pupils were poisoned by pesticide applications
Map of schools most exposed to pesticides in France
A Journey Through France : a scrollytelling story about exposure of the French population to pesticides, with a focus on exposure of schoolchildren
bjnnowak.quarto.pub/journey_to_f...
18.12.2024 14:15
👍 49
🔁 18
💬 5
📌 4

Like every year, we ask ourselves how likely a white Christmas is. The map shows the #climate frequency of snow on #christmas eve for Europe 🌍. #dataviz
18.12.2024 07:43
👍 89
🔁 31
💬 6
📌 7


