
Interesting thought ..
I will shoot our TMT standard on the astral. Should be quite easy to check :)
28.02.2026 16:17
👍 2
🔁 0
💬 0
📌 0
Interesting thought ..
I will shoot our TMT standard on the astral. Should be quite easy to check :)
My experience with TMT MS2 with FAIMS on an exploris is that it performed somewhere in between Tribrid MS2 and Tribrid MS3 with respect of ratio accuracy..
Our internal TMT standard / analysis is a bit different to the published approaches though …
Let’s see how this will look like.
With that second HR-TMT MS2 scan with HCD 55, the setup is actually quite close to an MS3 setup. Just the selection of fragment ions from the previous scan is missing..
And it’s quite cool that it’s possible with such a prism to do multiple rounds ..
I was waiting for this paper :)
It’s always nice to see the real profile-mode astral peaks. I wish we could do this also ourselves (for fun)..
I think the zoom is definitely better for TMT than the original astral but I 100% agree with you, one should do TMT in MS3-mode !!

For some projects like FFPE, we are also routinely doing TIC (pre-)normalization because every biochemical assay tells you something different and there is no better tool than a mass spec 🙃
pubmed.ncbi.nlm.nih.gov/39558110/ (see figure 2)
This is very useful.
Thanks for the effort !!

Proteoforms as the true units of physiological function link.springer.com/ar...
---
#proteomics #prot-paper
Yes. 100% agree.. That is bad MS2 co-isolation and ratio distortion :)
Good question how the *spectra* S/N is calculated by Thermo for the Astral...

Looking at the recent MacCoss paper, one needs to divide intensities of a OTs by 10x to get to intensities of ITs and Astrals pubs.acs.org/doi/10.1021/...
One would need to multiple with MS1 intensity to get better quantities, because otherwise it depends when the TMT was picked how much intensity (ions/sec) you end up with in that moment of time, how many peptides you sum, etc... TMT is "only" excellent in conserving ratios within a TMT experiment.
I don't see *spectra* S/N ratios reported in table S3.
They have mean vs. STD *protein intensity* over three replicates. I didn't go deep enough to their analysis, but normally people just sum up TMT report intensity to protein level. This intensity is however not indicative of actual quantities.
my understating was that the S/N cutoffs are the sum over all TMT reporters. So a threshold of 1440 S/N for an 18plex would be average 80 S/N per reporter.. are the purple numbers retained spectra?
Thanks for sharing this analysis. Just sad that good signal leads to poor resolution in TOF world.
What I was always wondering is if you could do a normal ion processor/HCD-MS2 scan and then for the MS3 scan do first HCD in the IRM and then select N Fragments (by optics n=1, SPS in the IRM?) and do the second HCD in the processor?
But happy that you guys are thinking about it :) :)
(2/2) For me, the problem with the Astral rather is that it currently does not support MS3. I don't mind running the MS at a lower Hz if I can get much better data from it. Every time I meet someone from thermo, I try to spark the MS3 idea. It hasn't ignited yet ..
The Deu-TMT requires careful planning of which samples go to which channel and requires a Deu/nonDeu-"bridge" sample to remove the Deu-RT effect. Then it works as expected.
(1/2)
A sneak preview is already online in proteomicsDB (www.proteomicsdb.org/analytics/KSR).
If you have questions, comments, or ideas, feel free to reach out.
In summary:
* 133 clinical kinase inhibitors x 5 cell lines
* >17 million peptidoform DRCs
* Critical re-evaluation of existing KSRs
* Proper FDR control for KSRs
* Identification of thousands of high-confidence KSRs
* Exposing how kinases shape cell line models and cancer patients

Did you ever come across a phosphosite in your proteomics data for which nothing was known? - I bet so!
We have developed a new strategy termed "potency coherence analysis" that leverages the drug potency dimension in decryptM to decode the kinases that shape the human phosphoproteome.
Read more:
The authors used CurveCurator to fit and evaluate all dose–response data across different omics assay types. CurveCurator’s scores let you set custom thresholds and interactively identify high-quality curves in ProteomicsDB.

Very happy to see that dose-response curves are now super easy to access for everyone in proteomicsDB. Just a few clicks and you can see at which concentrations your favorite drug engages protein target(s), tinkers with signaling pathways, and inhibits cell growth. Read more: doi.org/10.1093/nar/...

Exited to share our latest work! Out now in @natcomms.nature.com
Koina aims to transform how #proteomics uses machine learning. You no longer need to be a tech wizard to use ML and now can easily run #ML models. Integrated with FragPipe, Skyline and EncyclopeDIA!
www.nature.com/articles/s41...
A very clever approach to learn and predict MS2 spectra for modified peptides. By augmenting modification encodings and combining them with PROSIT, the new model has essentially generalized to ANY PTM - not just those in the training dataset. Super exciting !!
Great to hear that you like it :)
To your question if that data is already in prDB - decryptM: YES it is ! e.g.
www.proteomicsdb.org/drug/107070/...
also i can recommend the interactive dashboards.html on zenodo to explore the data locally
zenodo.org/records/1609...
Very excited to see this story out in Science Signaling!!
Especially the use of dose-dependent profiling at different time points could clearly separate immediate from late and consequential signaling changes in KRAS-driven (phospho)proteomes.
Yes crazy... I still remember the 1.8 million PDF pages we were printing to manually determine what a real dose-response was in the original decryptM paper. Luckily, this is over now :)
Let me know if you need some tricks for the time-dependent hack and good luck with the paper
At the Kusterlab, we have developed a statistical analysis tool (CurveCurator) to mine these proteome-wide dose-response curves. You may want to give it a try. github.com/kusterlab/cu...
3/3
A 1.5 orders of magnitude dose range is not really wide enough for a full dose-response curve, but if you have such a scaled-up workflow, you could easily extend it to more doses with good dose resolution. 2/3
I really like the regulome-wide profiling in a dose-dependent fashion. Going one step further, I would love to see actual TF dose-response curves in Figure 5. So not interpreting each dose individually as bar, but actually have a curve with potency and efficacy estimates for each protein. 1/3
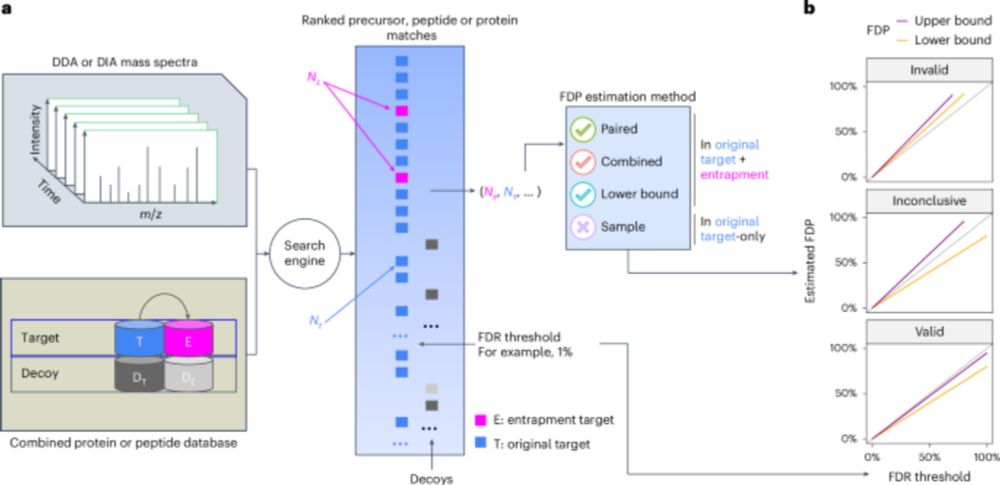
Assessing error control is fundamental in mass spectrometry-based proteomics. @bo-wen.bsky.social @maccoss.bsky.social @urikeich.bsky.social et al introduce a theoretical foundation for entrapment along with a method for more accurate evaluation of FDR control.
www.nature.com/articles/s41...