
Really excited to present work on tax base fragmentation at @umisr.bsky.social tomorrow! Come check it out!
11.02.2026 17:00
👍 8
🔁 5
💬 0
📌 0
Really excited to present work on tax base fragmentation at @umisr.bsky.social tomorrow! Come check it out!

Graphic with a quote and a photo of Sarah Patterson, Research Assistant Professor at the Institute for Social Research. Quote text reads: “Our findings show that the public continues to see the family as highly responsible for the care of older adults, but that levels of responsibility vary by relationship type.” Sarah Patterson is smiling, wearing glasses, a yellow cardigan, and black top, with the ISR building in the background.
Who should care for older adults, especially when dementia is involved?
New ISR research led by @spattersearch.bsky.social finds strong expectations for family caregiving, even as families shrink and needs grow.
Learn more about this study on caregiving expectations: myumi.ch/kPEqj

graphic for the Stone Center for Inequality Dynamics. A quote from Alexander Adames reads: “The community and opportunities provided by the Stone Center made Michigan the choice in deciding where to start my career as a wealth scholar.” To the right is a headshot of Alexander Adames, a smiling man with short curly hair wearing a white button-up shirt. The graphic includes the Stone Center for Inequality Dynamics logo at the bottom.
@umichstonecid.bsky.social at ISR has received a 5 million dollar gift from the Stone Foundation to advance research on wealth inequality and mobility.
Learn more about this gift to the Stone Center: myumi.ch/Nr4pD

Testimonial from Alexander Adames praising the Stone Center for its role in his decision to start his career as a wealth scholar at Michigan, with university and center branding.
We’re thrilled to share that @umichstonecid.bsky.social has received a new $5M gift from the Stone Foundation to continue our critical work to produce research on social inequality and train the next generation of #inequality scholars. Learn more:
myumi.ch/e35w2

You can help Bolts continue to provide crucial coverage of local elections. Here's how:
- Repost this = I donate $1.
- Follow @boltsmag.org = I donate $1.
- Donate (link below) + tell me how much = I match your donation.
(Donate monthly = I match a year's worth)
Cool new article alert 🚨: Tax Base Fragmentation as a Dimension of Metropolitan Inequality by @robertmanduca.bsky.social, @bhighsmith.bsky.social, Jacob Waggoner.
academic.oup.com/ser/article/...
Love seeing this use of our tax base fragmentation viz!!

🚨We analyzed 138 million geocoded property tax records to quantify how municipal boundaries spatially overlap onto economic segregation in every US metro area—creating disparities in localities’ ability to fund public goods. And we made an interactive map of our results! [1/16]
Check out this 🧵 on our own @robertmanduca.bsky.social's work with @bhighsmith.bsky.social and Jacob Waggoner. 👇 #AcademicSky #WealthInequality

We conceptualize ‘tax base fragmentation’: the spatial concentration (within a metro area) of property wealth in particular wealthy municipalities. The concept is intuitive—but not captured by existing measures of segregation and jurisdictional fragmentation. Link: academic.oup.com/ser/advance-...
Check out our new paper (+ the accompanying web viz)!
A new working paper from @umichstonecid.bsky.social/SRC researcher @robertmanduca.bsky.social examining the geography of social transfer programs & implications for cuts to Medicaid & SNAP in the recently signed federal budget.
Also see: equitablegrowth.org/medicaid-and...

In @marketwatch.com @robertmanduca.bsky.social helps break down what's at stake for local communities as a result of Medicaid cuts in the One Big Beautiful Bill—on average these safety-net programs account for 40 percent of money flowing into local communities.
www.marketwatch.com/story/how-th...
Hey that's @robertmanduca.bsky.social's research!

...
58% of military in CA-22 (Valadao)
223% of water transport (Staten Island ferries! largest private industry in district) in NY-11 (Malliotakis)
100% of pipeline transport in TX-15 (De La Cruz)
equitablegrowth.org/medicaid-and... h/t @robertmanduca.bsky.social @equitablegrowth.bsky.social
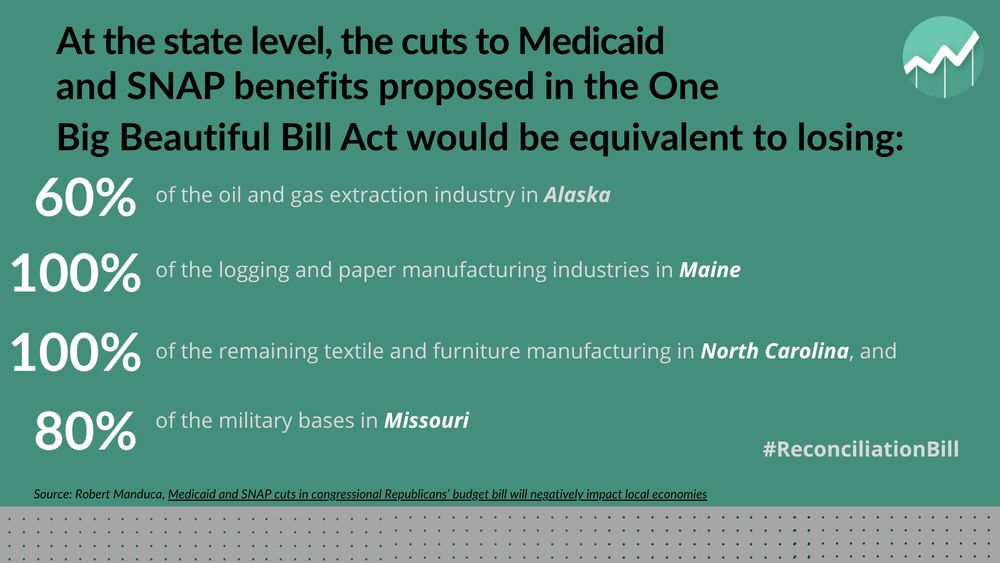
"Cuts to social programs will have a major impact on local economic activity." Social programs are a key part of the regional economic base. @robertmanduca.bsky.social on how Medicaid and SNAP cuts in the #ReconciliationBill will negatively impact local economies:
equitablegrowth.org/medicaid-and...
Starting in 10 minutes!
A lot of the discussion of the reconciliation bill has focused--rightly--on the consequences for beneficiaries of these programs. 11 million people are at risk of losing Medicaid coverage, and 4.5 million stand to lose SNAP. That's a ton. But the economic impacts may be even more widespread

In Kentucky's 5th congressional district, recently profiled by Arlie Hochschild for @nytimes.com, Medicaid makes up a quarter of the entire economic base. The SNAP and Medicaid cuts would be like losing one-third of all traded private sector industries
www.nytimes.com/2025/06/09/o...


If we look just at the proposed *cuts* to Medicaid and SNAP, it's the economic equivalent of Maine losing its entire forestry and paper manufacturing industries, all at once--or Alaska losing 60% of its oil and gas industry.

Put another way, Medicaid contributes roughly as much to Detroit's economy than car manufacturing, more to Houston than the chemical industry, almost twice as much to Los Angeles as motion picture production--these are big numbers!

As I describe in a post for @equitablegrowth.bsky.social, these programs are major foundations for local economies nationwide. Medicaid alone makes up about 11% of the economic base of US regions, and SNAP is about 1.4% equitablegrowth.org/medicaid-and...

Shifting from economic geography to policy, what does this mean for the current reconciliation bill? The House version is set to cut Medicaid and SNAP by about $1.2 trillion over the next 10 years--that's roughly a 12% cut to Medicaid and 27% to SNAP www.cbo.gov/publication/...

What's driving the change? @innovateeconomy.bsky.social reported last fall about the "Great Transfer-mation" across the US, attributing it to 1) aging populations, 2) rising healthcare costs, and 3) slower earnings growth eig.org/great-transf...

In some parts of Florida--looking at you, Cape Coral--traditional traded industries make up just *5 percent* of the economic base. The rest of the economy is based on retirement savings, pensions, Social Security, Medicare, etc.
Financial income made up another 26%. Traded sector earnings were just 24%: less than either of the other sources, and down from 35% in 2001

I compute the share of *all* economic base income that comes from transfers, financial income, and earnings in traded industries (the standard definition). The results are pretty striking: in 2022, transfer payments accounted for *40 percent* of the economic base across US regions

Usually, researchers define the economic base = traded industries only. But selling products to other cities or countries isn't the only way money can enter a local economy. I explore two other sources: financial income and government transfers. Like exports, these payments sustain the local sector

The two sectors play different roles in the local economy: most residents are employed by the local sector, which typically accounts for about 2/3 of jobs. But the traded sector is the ultimate foundation of a region's economic viability--its economic base
www.tandfonline.com/doi/abs/10.1...

Other industries--some examples are restaurants, grocery stores, home construction, mechanics--serve local, not national/global demand. These are the "town fillers," now usually called the "local" or "non-basic" sector