
NEW ANALYSIS: China's CO2 has now been 'flat or falling' for 21 months
* Down in 2025
* Still below Mar 2024
* Clean energy wave a key factor
If this is China's peak (TBC) it's the climate story of the century so far…
www.carbonbrief.org/...
12.02.2026 07:38
👍 1078
🔁 442
💬 21
📌 49

a map of southern south America showing the location of burning fires with lots of red dots.
Patagonian wildfires show how denying climate change & pushing environmental destruction make the reality of climate change much worse. Threatening the destruction of trees that have been alive when the bronze age collapsed. @wwattribution.bsky.social www.worldweatherattribution.org/climate-chan...
11.02.2026 09:13
👍 89
🔁 56
💬 2
📌 3

Top 10 countries in terms of their cumulative historical CO2 emissions from fossil fuels, cement, land use, land use change and forestry, 1850-2025, billion tonnes. Source: Source: Carbon Brief analysis of figures from Jones et al (2023), Lamboll et al (2023), the Global Carbon Project, CDIAC, Our World in Data, the International Energy Agency and Carbon Monitor.
NEW – Analysis: World’s biggest historic polluter – the US – is pulling out of UN climate treaty | @drsimevans.carbonbrief.org
Read here: buff.ly/ExACGm2
08.01.2026 13:17
👍 22
🔁 13
💬 3
📌 2
Royal Meteorological Society
The Royal Meteorological Society is the Learned and Professional Society for weather and climate. Our mission is to promote the understanding and application of meteorology for the benefit of all.
Closing TOMORROW – it was an honour to be on the panel for the @rmets.org Weather Photographer of the Year 2025, judging entries for the 'Climate' category. From over 4,000 images, 25 have made the shortlist and are open to the public vote, closing tomorrow.
Vote: www.rmets.org/weather-phot...
15.10.2025 13:03
👍 1
🔁 0
💬 0
📌 0

Factcheck: Trump’s climate report includes more than 100 false or misleading claims
NEW – Factcheck: Trump’s climate report includes more than 100 false or misleading claims | @ayeshatandon.carbonbrief.org @leohickman.carbonbrief.org @ceciliakeating.carbonbrief.org @rtmcswee.carbonbrief.org @tomoprater.carbonbrief.org
Read here: buff.ly/AvcB7Aw
14.08.2025 15:48
👍 233
🔁 134
💬 7
📌 18
Thanks! I’ve been designing graphics for WWA for a while now. This was the largest increase in likelihood to date
20.06.2025 22:18
👍 2
🔁 0
💬 0
📌 0

A stream graph chart showing the rise of nuclear power in the UK between 1960 and 1995, before declining in more recent years. With new investment, nuclear capacity is expected to increase again, and the chart shows a 2nd peak in the 2050s, albeit lower than in the 1990s.
The rise, fall and rise of UK nuclear power
The green light given to Sizewell C and other small modular reactors somewhat revives the UK’s nuclear capacity after decades of decline, albeit at a lower peak than the 1990s
Streamgraph for @carbonbrief.org #dataviz
www.carbonbrief.org/chart-the-ri...
17.06.2025 10:45
👍 11
🔁 1
💬 1
📌 2

Politicians shouldn't rage-bait chart geeks. on.ft.com/4jrlz8h
04.06.2025 08:23
👍 323
🔁 100
💬 6
📌 7
The New York Times weather team is a group of reporters and editors and designers and programmers who work with all the other departments in the newsroom to cover extreme weather and a few other things. You can follow some of us here bsky.app/starter-pack...
04.06.2025 17:35
👍 5
🔁 6
💬 0
📌 0

NEW ANALYSIS: UK's solar power surges 42% to a new record, after the sunniest spring on record
* For the first time, solar was >10% of UK generation in consecutive months (April/May 2025)
* In 2025, solar has already avoided gas imports that would've cost £600m
www.carbonbrief.org/analysis-uks...
04.06.2025 15:40
👍 454
🔁 177
💬 7
📌 19

Rapid population growth, poverty and frequent bouts of extreme rainfall are increasing the risk of catastrophic flooding in Kinshasa, the Democratic Republic of Congo’s capital city of nearly 18 million people.
Our study on the recent floods that killed at least 33 people was published today.
🧵
17.04.2025 09:56
👍 47
🔁 27
💬 1
📌 2

Anyone else see a scatter piggy?
17.04.2025 08:22
👍 5
🔁 0
💬 1
📌 0

📢ANALYSIS: UK emissions fell 3.6% in 2024 to lowest since 1872
🏭Coal lowest since 1666, when Great Fire ravaged London
🚗EVs pushed oil down despite more traffic, saving £1.7bn
🌇Gas down on "cleanest ever" power
📈📉Since 1990, CO2 -54% / GDP +84%
www.carbonbrief.org/...
1/9
12.03.2025 12:25
👍 1717
🔁 606
💬 44
📌 95


There were a lot of hexagons in this piece...
Brilliant analysis by @orladwyer.carbonbrief.org
24.02.2025 15:39
👍 6
🔁 1
💬 0
📌 0

World map showing 100 cases where crops have been destroyed by extreme weather, such as drought, rain and flooding or storms.
Extreme weather is destroying crops around the world, from hurricanes hitting bananas and yams in Jamaica, to drought ruining maize crops in Myanmar last year.
We mapped a global snapshot of the impacts from media reports for @carbonbrief.org
interactive.carbonbrief.org/crops-extrem... #dataviz
24.02.2025 15:39
👍 54
🔁 18
💬 5
📌 2

Line chart showing the cumulative rainfall per year in mm, from 1991 to 2024-25. Rainy winters in 2022-23 and 2023-24 were then followed by a very dry period in 2024.
New attribution study by WWA finds climate change increased the likelihood of wildfire disaster in Los Angeles
Cumulative annual rainfall chart for @wwattribution.bsky.social www.worldweatherattribution.org/climate-chan... #dataviz
29.01.2025 14:40
👍 18
🔁 4
💬 0
📌 0

Line chart showing the increase in aviation emissions if Heathrow, Gatwick and Luton airports were expanded.
A forest twice the size of Greater London would need to be planted in the UK to cancel out the extra emissions from the expansion of Heathrow, Gatwick and Luton airports.
That's more than 300,000 hectares...
Chart for @carbonbrief.org www.carbonbrief.org/analysis-uk-... #dataviz
28.01.2025 10:49
👍 73
🔁 35
💬 8
📌 3

World map showing 1,600+ locations of articles looking at on-the-ground responses to climate change and adaptation measures. There are noticeable clusters on the west coast and east coast of Africa, India, Bangladesh, east coast of the US and western Europe. There are also noticeable gaps in South America and north Africa.

A bar chart showing the different types of climate impacts communities are responding to. "General impacts" is top, followed by drought and precipitation/flooding

A grid plot showing all the articles mentioning climate change and adaptation measures in the US. There are a total of 139 out of the 1,682 papers that forms the dataset.
A network of researchers conducted a global stocktake of measures taken by communities forced to adapt to climate change.
We analysed 1,600+ peer-reviewed articles from the data looking at where, how and by whom these measures are being taken.
interactive.carbonbrief.org/climate-adap... #dataviz
07.01.2025 11:13
👍 1
🔁 1
💬 0
📌 0
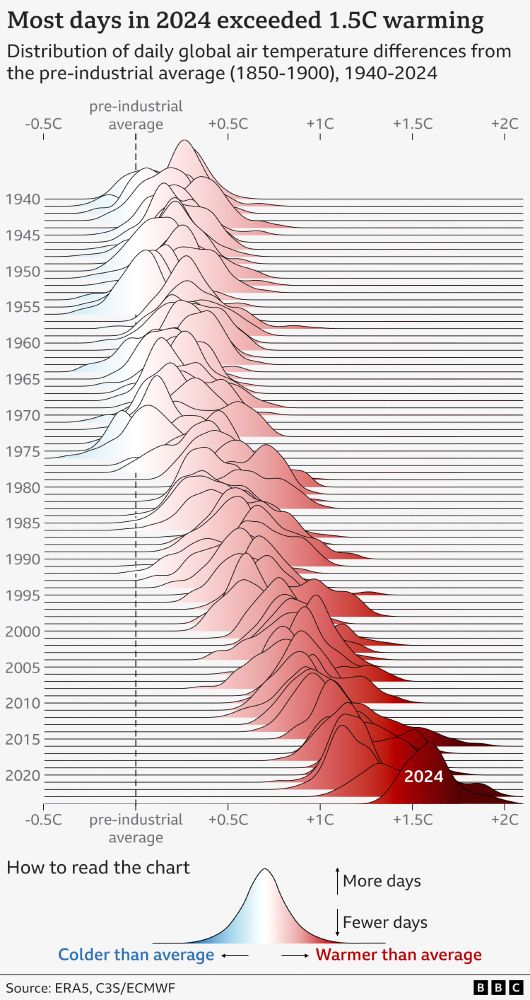
Ridgeline chart showing the distribution of global daily air temperature differences from the pre-industrial reference period (1850-1900), for every year between 1940 and 2024. Each individual year resembles a hill, shaded in a darker shade of red and further to the right for warmer years. The trend is clearly towards warmer years, with 2024 standing out as first year above 1.5C.
NEW: 2024 has just been confirmed as the warmest year on record, and the first to breach the 1.5C threshold.
We used a ridgeline (Joy Division inspired) chart to visualise daily temperature anomalies since 1940.
2024 clearly stands out with 100% of its days above 1.3C and 75% above 1.5C.
10.01.2025 08:04
👍 5914
🔁 2773
💬 211
📌 333

NEW ANALYSIS:
Right-leaning UK newspaper editorials have relentlessly attacked energy secretary Ed Miliband since last year's election, calling him "hysterical", a "madman" & "demented"
The papers have also published a record number of editorials opposing climate action…
1/2
10.01.2025 08:31
👍 233
🔁 147
💬 9
📌 15
World map showing 1,600+ locations of articles looking at on-the-ground responses to climate change and adaptation measures. There are noticeable clusters on the west coast and east coast of Africa, India, Bangladesh, east coast of the US and western Europe. There are also noticeable gaps in South America and north Africa.
A bar chart showing the different types of climate impacts communities are responding to. "General impacts" is top, followed by drought and precipitation/flooding
A grid plot showing all the articles mentioning climate change and adaptation measures in the US. There are a total of 139 out of the 1,682 papers that forms the dataset.
A network of researchers conducted a global stocktake of measures taken by communities forced to adapt to climate change.
We analysed 1,600+ peer-reviewed articles from the data looking at where, how and by whom these measures are being taken.
interactive.carbonbrief.org/climate-adap... #dataviz
07.01.2025 11:13
👍 1
🔁 1
💬 0
📌 0

Climate change intensified the series of five typhoons and a tropical storm that impacted the Philippines over 23 days in October and November.
Our study found that a greater number of typhoons landfalling in the country are reaching Category 3-5 levels as fossil fuel emissions heat the climate.
🧵
19.12.2024 17:41
👍 51
🔁 37
💬 1
📌 2

Offshore wind will form backbone of Britain's clean power 2030 target: Electricity generation by source on the GB grid in 2023 and 2030, terawatt hours (TWh), under two different NESO pathways to clean power. Low carbon dispatchable power includes gas with carbon capture and storage, hydrogen and biomass. Other renewables includes hydro and marine power. Other fossil includes coal, oil and diesel. Source: Clean Power 2030 Action Plan.
Analysis: How the UK plans to reach clean power by 2030 | @drsimevans.carbonbrief.org
@mollylempriere.carbonbrief.org
Read here: https://buff.ly/3BvkufV
13.12.2024 16:42
👍 56
🔁 22
💬 1
📌 3
I think if I was making this chart my initial approach would be the reverse and show "more" as darker/greater saturation and "less" as a lighter shade, as is more conventional use of colour in charts. Though you're right that those orgs often produce visuals this way
10.12.2024 09:36
👍 0
🔁 0
💬 0
📌 0

This ridgeline plot and the unconventional use of shading from white to blue to indicate sea ice loss is great. It also reinforces the impression of a dense ice pack breaking up.
Chart by @janatausch.bsky.social www.ft.com/content/63fb... #dataviz
09.12.2024 11:48
👍 101
🔁 27
💬 3
📌 4
NEW ANIMATION: China’s cumulative emissions have overtaken the EU for the first time…
…but under future projections, China’s emissions may *never* eclipse the US (despite having just a fraction of the population)
buff.ly/4hQ131z with @drsimevans.carbonbrief.org @vernerviisas.carbonbrief.org
19.11.2024 09:14
👍 76
🔁 46
💬 1
📌 6
Thanks Andy!
19.11.2024 10:21
👍 0
🔁 0
💬 0
📌 0


