Posts by Richard Rutter, author of Web Typography, and founder of Fontdeck and the Ampersand conferences.
Book: https://book.webtypography.net/
#typography #webtypography #fonts #design
Smashing Magazine's member community with free online community events, free ebooks, discounts to conferences and online workshop and a looooot of great peoples!
the web framework for content-driven websites 🚀 https://astro.build
The home for the communities of open source developers, engineers, researchers and designers who love and do Local First software.
Organizing the Local First devroom at FOSDEM'26 in Brussels. 1st Feb 2026.
https://openlocalfirst.org
Slowly going out on a limb. Making experimental creative tools on the web at http://constraint.systems. He/him. grantcuster.com
seeding discontent in present-day computing
libcomp.org • @folkjs.org
foraging the web: https://semble.so/profile/chrisshank.com
Personal computers, malleable software, hypermedia, augmenting the human intellect. Building HyperMap, a REST API format for the 21st century.
www.allpurposemachines.com — open-source projects
www.auxilit.com — personal site
Norwich, UK // He/Him
independent consultant, designing and developing computational interfaces; currently exploring at Google Creative Lab
https://szymonkaliski.com
computer collective
https://tentpole.computer
i want to squish software between my fingers
@inkandswitch.com Δ feelingof.com Δ ivanish.ca
profile photo by @seaofclouds.com
Leo’s 아빠. Making things with computation. Interested in augmented reality. Posting about projects, movies, music. He/him.
XR works: https://lossless.mmm.page
Mastodon: @lossless@mastodon.social
ML, λ • language and the machines that understand it • https://ocramz.github.io
body { will-change: transform; }
💌 https://eva.town
📺 https://hypertext.tv
🏳️⚧️ @namesake.fyi
CIM - interdisciplinary research centre at Uni. of Warwick - innovative & experimental knowledge production, methodology focus, expanding roles of interdisciplinary methods, new lines of inquiry across disciplinary boundaries.
https://warwick.ac.uk/cim
advocating widespread dissatisfaction with computing.
researcher @inkandswitch.com + libcomp.org
½ @folkjs.org ¼ @tentpole.bsky.social
Design Engineer at the NHS (UCLH) 👩🏻💻 https://mimireyburn.com/
Researcher-in-Residence at @inkandswitch.com
📣 All views are my own (she/her)
📍 London, UK
ugly girl ⟁ your biggest fan ◬ https://chee.party ◉ not part of tentpole ❣︎ https://feelingof.london
📗 public data cultures https://jonathangray.org/publicdatacultures
🌱 codirector @digitalculturekcl.bsky.social reader @kingsdh.bsky.social king's college london cofounder @publicdatalab.bsky.social
🫧 feminist STS, internet studies, poetic computation
Non-profit organisation. Critical AI literacy - critical thinking about AI and better narratives about AI for public power. Powered by volunteers
Our websites:
BetterImagesofAI.org
WeandAI.org
Clarity, at a glance - www.trmnl.com
Independent design systems designer. 📐 Now @ Baseline, prev. Webflow, Twitter, & Figma. I love making the things that help others do their thing.
👋 baselinedesign.com
📬 newsletter.baselinedesign.com
Exploring creative tools and AI. Design Director @Superhuman/Grammarly
prototypes @wikipedia.org
prev @tldraw.com
prev @inkandswitch.com
London
todepond.com
Parent, spouse, Australian, Professor of Machine Learning in Oxford. Long Covid, trans rights, music, reggae, AI must be good for humans, https://www.robots.ox.ac.uk/~mosb
👩💻 Creative developer
👩🎨 Organising c3s - community for co-creating with code in London
🦉 All views my own
📍 London, sometimes Tokyo
Dataviz, comics, Data art
http://eolay.tilda.ws/en
Design engineer playing with AI and hacky prototypes @githubnext.com
Adores digital gardening, end-user development, and embodied cognition. Makes visual essays about design, programming, and anthropology.
📍 London
🌱 maggieappleton.com
An independent research lab exploring the future of tools for thought.
We envision a new computer that amplifies human intelligence. A system that helps you think more clearly, collaborate more effectively, and is available anywhere and anytime.
Cofounder of Clearleft, author of Web Typography, rider of bicycles, listener to vinyl, father of two, husband. Not necessarily in that order.
Blog: https://clagnut.com/
Book: https://book.webtypography.net/
Also: https://mastodon.social/@Richr
We are Clearleft – strategic design partners.
https://clearleft.com/
Proud to be #EmployeeOwned 🫶 Also, proudly responsible for
https://uxlondon.com and https://leadingdesign.com/
digital music and visuals designer, software builder, generative process collaborator for the performing arts. grapheme-colour synæsthete.
Indie developer and educator. Blogging at http://joshwcomeau.com.
Previously at DigitalOcean, Khan Academy. Taught at Concordia Bootcamps.
He/Him 🌈
She/her. WordPress developer, music maker, festival goer, cider drinker.
https://makeaspectacle.co.uk
designer for real humans / author / speaker / educator / acab / buy my fuckin book / take my fuckin course
Mindful Design video course:
https://piccalil.li/mindful-design
Other gaffs:
https://scott.is
https://mindfuldesign.xyz
writer, artist, alleged geographer. editing at large at urbanomnibus.net. research fellow at SFE. buttondown.email/perfectsentences is a little hobby newsletter. past work: lifewinning.com. dissertation blog: placing.technology. views adamantly mine
Huge pupils, tiny value
webcurios.co.uk
maps | data | code | journalism
#D3 & #Observable
👁️🗨️ https://observablehq.com/@fil
🌍 https://visionscarto.net/
Freelance data visualization designer and #D3js developer based in Mensk, Belarus. Open for hire worldwide #datavis @ yanouski.com
#dataviz enthusiast & interactive storyteller. Building visual essays, dashboards, and tech projects.
Pro sectors: electronics, semiconductors.
More at ThisIsJam.es
I run the Info Vis Group in Barcelona:
www.infovisgroup.org
Visualization, urbanism, critical data. MIT DUSP alumnus, faculty Northeastern.
https://offenhuber.net
https://autographic.design
Data and Graphics reporter at @theobserveruk.bsky.social. They/them
Message tips on signal @ bexsander.32
https://rj-sander.github.io/
MBBS MSc PhD | Epidemiologist working on clinical research in Singapore. I enjoy reading all things science.
Climate visuals @carbonbrief.org
Building @revisual.co - one of India's first information design studios / Chart maker, information designer and developer, data journo, trainer #dataviz
Organisers of https://londonwebstandards.org and https://stateofthebrowser.com
organisers[at]londonwebstandards.org
We’re an information design and development agency crafting memorable data stories. Rooted in India with a global outlook. 💻 https://revisual.co/ 💻
#dataviz #informationdesign
She/her. Not Danielle, Daniela, or Daniel. Kneader of words and curator of colours. Afraid for the future. Proud NL/UK dual national. Climate, politics, dataviz, editing, craft, birds. Omni 🏳️🌈 Views own. https://datayarns.wordpress.com/
Information designer, Data visualization engineer
at The Straits Times, Information design lecturer at the Lviv Arts Academy, US Fulbright Alumni | Opinions Are My Own
🌐 romansverdan.com
🌐 diagrammm.com
🌐 observablehq.com/@romansverdan
Navigating data, design, and complex systems. Dataviz Designer @ Grafana Labs. Formerly at Flatiron Health. Sabeti Lab & Northeastern alum. 🇨🇷 migrante.
non-practicing intellectual on war & tech
NL/EN
Dataviz designer & journalist at the Financial Times
Before: BBC News, UCB Biopharma, MIT Senseable City Lab | Northeastern alumni with Becarios Fundación La Caixa | In the past, 🇪🇸 in 🇺🇸 🇬🇧 🇩🇪
Website: https://irenedelatorrearenas.com
bio.rodolfoalmeida.info ✹ onorock.net
i write the data-driven politics newsletter Strength In Numbers: gelliottmorris.com/subscribe
wrote a book by the same name wwnorton.com/books/Strength-in-Numbers
polling averages at @fiftyplusone.news
formerly @ 538 & The Economist. email, don't DM, me
Columnist and chief data reporter the Financial Times | Stories, stats & scatterplots | john.burn-murdoch@ft.com
📝 ft.com/jbm
Creator of 📰 News feeds, @xblock.aendra.dev, @moji.blue, founder of @shoots.green, co-organiser @atproto.london.
Opinions my own. Not a journalist or an engineer, but a secret third thing (panicked).
she/her/ze/hir 🏳️⚧️
🌐 aendra.com
🗞️ ft.com/æ
The FT’s team of reporters, statisticians, illustrators, cartographers, designers, and developers work with colleagues across our newsrooms, using graphics and data to find, investigate and explain stories.
https://www.ft.com/visual-and-data-journalism
Math, hockey, viz, apocrypha
Assoc Prof Computer Science and Communication Studies at Northwestern. Infovis, HCI. Author of tidybayes & ggdist R pkgs. he/him. 🏳️🌈 https://mjskay.com/
Co-director https://mucollective.northwestern.edu
Co-founder https://journalovi.org
Already living in the future of news at Newspack. Board at @muckrock. Former @propublica. Hoping for the best.
Writing about tech, power, data visualization, social media, disability. Assistant prof of computational media @ MIT. 🇹🇼
crystaljjlee.com
Visual perception and cognition scientist
(he/him)
My site: http://steveharoz.com
R guide: https://r-guide.steveharoz.com
StatCheck Simple: http://statcheck.steveharoz.com
Into creative ML/AI, NLP, data science and digital humanities, narrative, infovis, games, sf & f. Consultant, ds in Residence at Google Arts & Culture. (Lyon, FR) Newsletter arnicas.substack.com.
— Founder of Our World in Data
— Professor at the University of Oxford
Data to understand global problems and research to make progress against them.
Climate scientist, geologist, and catastrophe modeler, Liberty Mutual. Posts on all things hurricane, wildfire, flood, earthquake, tornado. Sassy takes are mine not employer's.
📍Oakland, CA
Website: hereidk.strikingly.com
Writer in upstate New York. Hiring or looking for freelance? Let's talk! Formerly: Minnesota Reformer, Washington Post, Brookings, Pew. Orange cat evangelist. Ask me about my swamp.
Axios managing editor for data viz, previously at Pew Research
My favorite things are quilts, birds, books and maps
Solopreneur @ IndieVisual
Data geek who loves problem solving
Rambles about fitness & random stuff too
https://indievisual.tech
🧙♂️✨📊
Independent Data Visualization Designer, Consultant & Instructor | available for projects and workshops
All things data & design with #rstats, #ggplot2, #Figma, #DataWrapper, #Flourish, and more
Co-Founder of the #30DayChartChallenge
Asst Professing at MIT CSAIL. Data visualization, ML interpretability, accessibility, cognitively convivial information.
climate tech, dataviz, scuba diving and cockatiels
rachelbinx.com
glitchclouds.com
Human/AI interaction. ML interpretability. Visualization as design, science, art. Professor at Harvard, and part-time at Google DeepMind.
Visualisation and graphics @posit.co
Classic Generative Art Weirdo using 🖤 and R: http://thomaslinpedersen.art and http://deca.art/thomasp85
he/him
Data and visual journalist, New York Times climate team
https://www.nytimes.com/by/mira-rojanasakul
Washington Post Opinion Design and visuals Director. Prev National Geographic, Boston Globe and Spain.
If I'm writing in Spanish is probably about fútbol.
European and American.
Portfolio: https://chiquiesteban.me/
Helping you better understand web accessibility for people with disabilities. Created by @patrickmgarvin.bsky.social.
Data visualizations & information graphics by David McCandless. Plus favourite finds & graphics from around the web. Making sense of the world - well, trying to - since 2009.
https://linktr.ee/infobeautiful
software engineer | #rstats | PDX | she/her
ASA Fellow; #rstats developer of graphical methods for categorical and multivariate data; #datavis history of data visualization; #historicaldatavis; Milestones project
Web: www.datavis.ca
GitHub: github.com/friendly
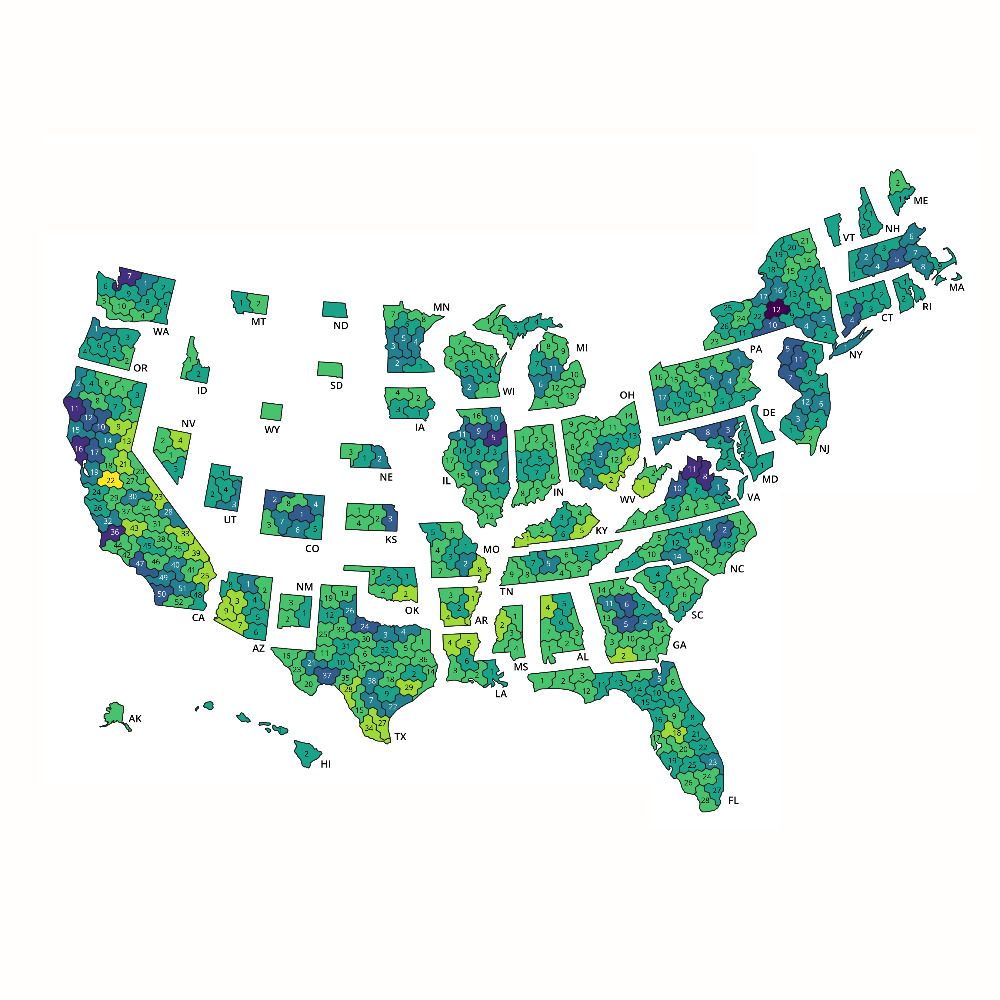
Contributor @the-downballot.com. Focusing on data, maps, and demographics. Find our data (and the CD hexmap template!) at https://the-db.co/data
Ginni Rometty Prof @NorthwesternCS | Fellow @NU_IPR | AI, people, uncertainty, beliefs, decisions, metascience | Blog @statmodeling
Head of data journalism at The Economist
Playing with data, visualizing it for humans at flowingdata.com
Infographisme @LePoint, passée par Libé, Le Monde et WeDoData // Une des moitiés de GoumProd // J’aime beaucoup les cartes
Visualization toolmaker. Founder of Observable. Creator of D3. Former NYT Graphics. Pronounced BOSS-tock.
Visualization, data, AI/ML. Professor at CMU (@dig.cmu.edu, @hcii.cmu.edu) and researcher at Apple. Also sailboats ⛵️ and chocolate 🍫.
www.domoritz.de
-Mapping the world- Dr. in Physical Geography | environmental health - bioclimatology - geography. RC Researcher from 🇩🇪 at @mbgcsic.bsky.social @csic.es in 🇪🇸 #rstats #dataviz
Secretary of the @aeclim.org
📍Galicia
ℹ️ https://dominicroye.github.io
Creative Technologist | Data Visualization Designer & Developer | Researcher.
Building websites at nussknagger.com
Always learning something new. (he/him)
https://sebastianlammers.com/
Powerpoint by day, #ggplot2 by night. Here for dataviz and #rstats content and rants about football. 📊⚽️
Based in Cologne, Germany.
Raleigh. How might we visualize people, fairly and equitably? Data / dataviz / design / psychology / research geek. He / him. Chaotic good. Follows Fizzlethorpe Bristlebane. Design / research / writing at https://3iap.com.
Graphics editor at Scientific American. Medical illustrator-turned-datavizzer, New Yorker, parent. She/her. These views are mine, get your own. https://amandamontanez.com/
I design and develop interfaces for technical domains. Past lives in arch/history of arch. Generally interested in: ∩ of data/image/language; history of most things; frontend dev/web/TS; learning; dad jokes. Camberville, MA
Data visualization consultant at the Development Data Group of the World Bank
www.maartenlambrechts.com
Politics & Society Lead @ourworldindata.org. I make research on democracy, human rights, and conflict easier to access and understand. he/him
Check out my work: https://ourworldindata.org/team/bastian-herre
https://openclimatedata.net/
📊 data visualization engineer, 💊 healthcare analytics consultant, 🐶 dog mom, 🌱 vegan for the animals.
https://nicolemark.heygrid.co/
Data Visualization in Life and Health Science. PhD biology, trained in art, Associate Prof
Writes here: https://helenajamborwrites.netlify.app/
Following science & political content, posting mainly science
Loc: Chur, Dresden, Lüneburg
generative artist and prof, data visualization developer, identity-challenged
dataviz: https://do.minik.us
art: https://dominikus.art
Americas editor, @graphics.reuters.com. Once: FiveThirtyEight, CUNY adjunct. Almost Canadian.